Kubernetes 1.8: Hidden Gems – The Resource Metrics API, the Custom Metrics API and HPA v2 /

By Luke Addison

In the coming weeks we will be releasing a series of blog posts called Kubernetes 1.8: Hidden Gems, accenting some of the less obvious but wonderful features in the latest Kubernetes release. In this week’s gem, Luke looks at some of the main components in the core metrics and monitoring pipelines and in particular how they can be used to scale Kubernetes workloads.

One of the features that makes Kubernetes so powerful is its extensibility. In particular, Kubernetes allows developers to easily extend the core API Server with their own API servers, which we will refer to as ‘add-on’ API servers. The resource metrics API (also known as the master metrics API or just the metrics API) introduced in 1.8 and the custom metrics API, introduced in 1.6, are implemented in exactly this way. The resource metrics API is designed to be consumed by core system components, such as the scheduler and kubectl top, whilst the custom metrics API has a wider use case.

One Kubernetes component that makes use of both the resource metrics API and the custom metrics API is the HorizontalPodAutoscaler (HPA) controller which manages HPA resources. HPA resources are used to automatically scale the number of Pods in a ReplicationController, Deployment or ReplicaSet based on observed metrics (note that StatefulSet is not supported).

The first version of HPA (v1) was only able to scale based on observed CPU utilisation. Although useful for some cases, CPU is not always the most suitable or relevant metric to autoscale an application. HPA v2, introduced in 1.6, is able to scale based on custom metrics and has been moved from alpha to beta in 1.8. This allows users to scale on any number of application-specific metrics; for example, metrics might include the length of a queue and ingress requests per second.

The purpose of the resource metrics API is to provide a stable, versioned API that core Kubernetes components can rely on. Implementations of the API provide resource usage metrics for pods and nodes through the API Server and form part of the core metrics pipeline.

In order to get a resource metrics add-on API server up and running we first need to configure the aggregation layer. The aggregation layer is a new feature in Kubernetes 1.7 that allows add-on API servers to register themselves with kube-aggregator. The aggregator will then proxy relevant requests to these add-on API servers so that they can serve custom API resources.

kube-aggregator architecture

Configuring the aggregation layer involves setting a number of flags on the API Server. The exact flags can be found here and more information about these flags can be found in the kube-apiserver reference documentation. In order to set these flags you will need to obtain a CA certificate if your cluster provider has not taken care of that already. For more details on the various CAs used by the API Server, take a look at the excellent apiserver-builder documentation.

We now need to deploy the add-on API Server itself to serve these metrics. We can use Heapster’s implementation of the resource metrics API by running it with the –api-server flag set to true, however the recommended way is to deploy metrics-server, which is a slimmed-down version of Heapster specifically designed to serve resource usage metrics. You can do this using the deployment manifests provided in the metrics-server repository. Pay special attention to the APIService resource included with the manifests. This resource claims a URL path in the Kubernetes API (/apis/metrics.k8s.io/v1beta1 in this case) and tells the aggregator to proxy anything sent to that path to the registered service. For more information about metrics-server check out the metrics-server repository.

To test our resource metrics API we can use kubectl get –raw. The following command should return a list of resource usage metrics for all the nodes in our cluster.

$ kubectl get –raw “/apis/metrics.k8s.io/v1beta1/nodes” | jq
{
“kind”: “NodeMetricsList”,
“apiVersion”: “metrics.k8s.io/v1beta1”,
“metadata”: {
“selfLink”: “/apis/metrics.k8s.io/v1beta1/nodes”
},
“items”: [
{
“metadata”: {
“name”: “node1.lukeaddison.co.uk”,
“selfLink”: “/apis/metrics.k8s.io/v1beta1/nodes/node1.lukeaddison.co.uk”,
“creationTimestamp”: “2017-10-09T14:21:06Z”
},
“timestamp”: “2017-10-09T14:21:00Z”,
“window”: “1m0s”,
“usage”: {
“cpu”: “247m”,
“memory”: “1846432Ki”
}
},
{
“metadata”: {
“name”: “node2.lukeaddison.co.uk”,
“selfLink”: “/apis/metrics.k8s.io/v1beta1/nodes/node2.lukeaddison.co.uk”,
“creationTimestamp”: “2017-10-09T14:21:06Z”
},
“timestamp”: “2017-10-09T14:21:00Z”,
“window”: “1m0s”,
“usage”: {
“cpu”: “511m”,
“memory”: “3589560Ki”
}
},
{
“metadata”: {
“name”: “node3.lukeaddison.co.uk”,
“selfLink”: “/apis/metrics.k8s.io/v1beta1/nodes/node3.lukeaddison.co.uk”,
“creationTimestamp”: “2017-10-09T14:21:06Z”
},
“timestamp”: “2017-10-09T14:21:00Z”,
“window”: “1m0s”,
“usage”: {
“cpu”: “301m”,
“memory”: “2453620Ki”
}
}
]
}

The resource metrics API allows HPA v2 to scale on resource metrics such as CPU and memory usage, however this API does not allow us to consume application specific metrics – we need something extra.

The purpose of the custom metrics API is to provide a stable, versioned API that end-users and Kubernetes components can rely on. Implementations of the custom metrics API provide custom metrics to the HPA controller and form part of the monitoring pipeline.

The steps required to configure your cluster to use a custom metrics API implementation can be found in the Kubernetes HPA docs. There are not a huge number of implementations yet and none that are officially part of Kubernetes, but a good one to try at the moment is the Prometheus adapter. This adapter translates queries for custom metrics into PromQL, the Prometheus query language, in order to query Prometheus itself and pass the results back to the caller.

There is a nice walk-through by DirectXMan12 that covers cluster prerequisites, how to deploy Prometheus and how to inject a Prometheus adapter container into your Prometheus deployment. This adapter can then be registered with the API Server using an APIService resource to tell the aggregator where to forward requests for custom metrics. Note that the walk-through uses the API Server path /apis/custom-metrics.metrics.k8s.io but for 1.8 a decision was made to use /apis/custom.metrics.k8s.io so you will need to change your APIService resource appropriately. luxas has a nice example of everything – thanks!

As before, we can test our new add-on API server using kubectl get –raw. The following command should return a list of all custom metrics from the Prometheus adapter.

$ kubectl get –raw “/apis/custom.metrics.k8s.io/v1beta1” | jq
{
“kind”: “APIResourceList”,
“apiVersion”: “v1”,
“groupVersion”: “custom.metrics.k8s.io/v1beta1”,
“resources”: [
{
“name”: “pods/tasks_state”,
“singularName”: “”,
“namespaced”: true,
“kind”: “MetricValueList”,
“verbs”: [
“get”
]
},
{
“name”: “pods/memory_failcnt”,
“singularName”: “”,
“namespaced”: true,
“kind”: “MetricValueList”,
“verbs”: [
“get”
]
},

{
“name”: “pods/memory_swap”,
“singularName”: “”,
“namespaced”: true,
“kind”: “MetricValueList”,
“verbs”: [
“get”
]
}
]
}

With the Prometheus adapter deployed, we can use the power of Prometheus to scale our workloads on custom metrics specifically tailored to our applications.

The following example shows a HPA that scales an nginx deployment using a single resource metric (CPU) and two custom metrics (packets-per-second and requests-per-second)

apiVersion: autoscaling/v2beta1
kind: HorizontalPodAutoscaler
metadata:
name: nginx
spec:
scaleTargetRef:
apiVersion: apps/v1beta1
kind: Deployment
name: nginx
minReplicas: 1
maxReplicas: 10
metrics:
– type: Resource
resource:
name: cpu
targetAverageUtilization: 50
– type: Pods
pods:
metricName: packets-per-second
targetAverageValue: 1k
– type: Object
object:
metricName: requests-per-second
target:
apiVersion: extensions/v1beta1
kind: Ingress
name: main-route
targetValue: 2k

  • To get the value for the resource metric, the HPA controller uses the resource metrics API by querying the API Server path /apis/metrics.k8s.io/v1beta1/pods.
  • For custom metrics, the HPA controller uses the custom metrics API and will query the API server paths /apis/custom.metrics.k8s.io/v1beta1/namespaces/default/pods/*/packets-per-second for type Pods and /apis/custom.metrics.k8s.io/v1beta1/namespaces/default/ingress.extensions/main-route/requests-per-second for type Object.

Note that these APIs are still in a beta status, and so may still be subject to changes. If you are using these APIs, please check the Kubernetes release notes before performing cluster upgrades to ensure your old resources are still valid.

Source

Migrating from Rancher 1.6 to Rancher 2.0 – A Short Checklist

How to Migrate from Rancher 1.6 to Rancher 2.1 Online Meetup

Key terminology differences, implementing key elements, and transforming Compose to YAML

Watch the video

Rancher 1.6 is a widely used container orchestration platform that runs and manages Docker and Kubernetes in production. Cattle is the base orchestration engine for Rancher 1.6 that is being used by many opensource and enterprise setups.

With the release of Rancher 2.0, we shifted from Cattle as the base orchestration platform to Kubernetes. As aptly noted here, Rancher 2.0 aims at helping users align with the Kubernetes Everywhere reality of the infrastructure and cloud domain.

However Rancher 2.0 differs from Rancher 1.6 because it brings in a new orchestration technology, Kubernetes. Currently, there is no straightforward upgrade path available between these versions.

So as a Rancher 1.6 user who’s interested in moving to 2.0, what steps should you take?

Checklist for Migration

In this article, I will provide a short checklist you can follow to do the migration:

Installation

Instructions for a Rancher 2.0 installation can be found in the Rancher Documentation.

Note that the Docker versions currently supported by Rancher 2.0 are:

  • 1.12.6
  • 1.13.1
  • 17.03.2

This list is per the validated Docker versions found under External Dependencies in the Kubernetes upstream release.

For Kubernetes, Rancher currently uses the 1.10 version and is planning to go with the 1.11 version in the upcoming 2.0.7 release. Rancher will keep updating to the most-recent upstream Kubernetes releases.

For a basic single node dev installation, you would provision a single Linux host with Docker and install Rancher within a Docker container using the familiar docker run command, just like the Rancher 1.6 installation.

docker run -d –restart=unless-stopped
-p 80:80 -p 443:443
rancher/rancher:latest

For development environments, we recommend installing Rancher by running a single Docker container.

One difference from the 1.6 version is that Rancher now requires you to use SSL for security, so you need to provide a certificate during installation. If you don’t provide a certificate, Rancher will generate a self-signed certificate for you. For all the certificate options, see here.

Installing a High Availability Rancher setup is a lot different compared to 1.6. The steps are outlined here.

Note that any existing automation that you have around a 1.6 Rancher Server in HA mode will need to be redone for 2.0.

Configure Authentication

If you have set up authentication with Rancher 1.6, you will be familiar with the array of auth providers supported.

Imgur

With Rancher 2.0, all the above auth providers are still supported, and there are few new ones added to the set as well! Here is what the upcoming v2.0.7 authentication provider line up looks like:

Imgur

The basic configuration requirements for setting up auth are still the same as 1.6. Look here for detailed documentation about configuring every auth provider.

One difference to highlight is that in the Rancher 2.0 setup, local auth is always turned on, even if you configure any other auth mechanism. This setting enables the Rancher admins to have a guaranteed access to the setup always!

Add a Cluster and a Project

After you have a running Rancher installation with your choice of authentication enabled, the next thing to do is create a Cluster and a Project under which workloads can be deployed.

In the Rancher 1.6 setup, after installation, you would create an environment to which compute nodes could be added. In Rancher 2.0, you need to create a cluster and add the compute nodes to the cluster.

This is what the Cluster view looks like after it is setup. Within each cluster a Default project will be available.

Imgur

The equivalent of a 1.6 Cattle environment is a 2.0 cluster with a project, for the following reasons:

  • In 1.6 compute resources were assigned to an environment. Here in 2.0, you assign them to a cluster.
  • In 1.6 users were added to the environment, where they could deploy services and share access to the hosts that belonged to that environment. In 2.0, users are added to projects and the workloads they deploy have access to the resources granted to the project.

This model of a cluster and a project allows for multi-tenancy because hosts are owned by the cluster, and the cluster can be further divided into multiple projects where users can manage their apps.

Create Namespaces

After adding a cluster and a project, the next step is to define any namespaces used to group your application workloads. In Rancher 1.6, stacks were created to group together the services belonging to your application. In 2.0, you need to create namespaces for the same purpose. A default namespace will be available within the project, which is the namespace where workloads are deployed if one is not explicitly provided.

Just like 1.6, Rancher 2.0 supports service discovery within and across namespaces.

Imgur

Migrate Apps

Once your Kubernetes cluster and a project are in place, the next step is to migrate the workloads.

  • If you are a Rancher 1.6 user using Cattle environments, then you’ll need to understand the changes in Rancher 2.0 around scheduling, load balancing, service discovery, service monitoring, and more while you migrate your workloads.

    You can follow the upcoming blog series that talks about how you can do this migration using either the Rancher 2.0 UI or a conversion from Docker Compose config to Kubernetes YAML. It aims to explore various areas around workload deployment and their equivalent options available in Rancher 2.0.

  • If you have been running your workloads in a Rancher 1.6 Kubernetes environment already, you can import the Kubernetes YAML specs directly into a Rancher 2.0 cluster using either the UI or Rancher CLI.

Hope this migration checklist helps you get started!

Prachi Damle

Prachi Damle

Principal Software Engineer

Source

Dynamically Expand Volume with CSI and Kubernetes

There is a very powerful storage subsystem within Kubernetes itself, covering a fairly broad spectrum of use cases. Whereas, when planning to build a product-grade relational database platform with Kubernetes, we face a big challenge: coming up with storage. This article describes how to extend latest Container Storage Interface 0.2.0 and integrate with Kubernetes, and demonstrates the essential facet of dynamically expanding volume capacity.

Introduction

As we focalize our customers, especially in financial space, there is a huge upswell in the adoption of container orchestration technology.

They are looking forward to open source solutions to redesign already existing monolithic applications, which have been running for several years on virtualization infrastructure or bare metal.

Considering extensibility and the extent of technical maturity, Kubernetes and Docker are at the very top of the list. But migrating monolithic applications to a distributed orchestration like Kubernetes is challenging, the relational database is critical for the migration.

With respect to the relational database, we should pay attention to storage. There is a very powerful storage subsystem within Kubernetes itself. It is very useful and covers a fairly broad spectrum of use cases. When planning to run a relational database with Kubernetes in production, we face a big challenge: coming up with storage. There are still some fundamental functionalities which are left unimplemented. Specifically, dynamically expanding volume. It sounds boring but is highly required, except for actions like create and delete and mount and unmount.

Currently, expanding volume is only available with those storage provisioners:

  • gcePersistentDisk
  • awsElasticBlockStore
  • OpenStack Cinder
  • glusterfs
  • rbd

In order to enable this feature, we should set feature gate ExpandPersistentVolumes true and turn on the PersistentVolumeClaimResize admission plugin. Once PersistentVolumeClaimResize has been enabled, resizing will be allowed by a Storage Class whose allowVolumeExpansion field is set to true.

Unfortunately, dynamically expanding volume through the Container Storage Interface (CSI) and Kubernetes is unavailable, even though the underlying storage providers have this feature.

This article will give a simplified view of CSI, followed by a walkthrough of how to introduce a new expanding volume feature on the existing CSI and Kubernetes. Finally, the article will demonstrate how to dynamically expand volume capacity.

Container Storage Interface (CSI)

To have a better understanding of what we’re going to do, the first thing we need to know is what the Container Storage Interface is. Currently, there are still some problems for already existing storage subsystem within Kubernetes. Storage driver code is maintained in the Kubernetes core repository which is difficult to test. But beyond that, Kubernetes needs to give permissions to storage vendors to check code into the Kubernetes core repository. Ideally, that should be implemented externally.

CSI is designed to define an industry standard that will enable storage providers who enable CSI to be available across container orchestration systems that support CSI.

This diagram depicts a kind of high-level Kubernetes archetypes integrated with CSI:

csi diagram

  • Three new external components are introduced to decouple Kubernetes and Storage Provider logic
  • Blue arrows present the conventional way to call against API Server
  • Red arrows present gRPC to call against Volume Driver

For more details, please visit: https://github.com/container-storage-interface/spec/blob/master/spec.md

Extend CSI and Kubernetes

In order to enable the feature of expanding volume atop Kubernetes, we should extend several components including CSI specification, “in-tree” volume plugin, external-provisioner and external-attacher.

Extend CSI spec

The feature of expanding volume is still undefined in latest CSI 0.2.0. The new 3 RPCs, including RequiresFSResize and ControllerResizeVolume and NodeResizeVolume, should be introduced.

service Controller {
rpc CreateVolume (CreateVolumeRequest)
returns (CreateVolumeResponse) {}
……
rpc RequiresFSResize (RequiresFSResizeRequest)
returns (RequiresFSResizeResponse) {}
rpc ControllerResizeVolume (ControllerResizeVolumeRequest)
returns (ControllerResizeVolumeResponse) {}
}

service Node {
rpc NodeStageVolume (NodeStageVolumeRequest)
returns (NodeStageVolumeResponse) {}
……
rpc NodeResizeVolume (NodeResizeVolumeRequest)
returns (NodeResizeVolumeResponse) {}
}

Extend “In-Tree” Volume Plugin

In addition to the extend CSI specification, the csiPlugin interface within Kubernetes should also implement expandablePlugin. The csiPlugin interface will expand PersistentVolumeClaim representing for ExpanderController.

type ExpandableVolumePlugin interface {
VolumePlugin
ExpandVolumeDevice(spec Spec, newSize resource.Quantity, oldSize resource.Quantity) (resource.Quantity, error)
RequiresFSResize() bool
}

Implement Volume Driver

Finally, to abstract complexity of the implementation, we should hard code the separate storage provider management logic into the following functions which is well-defined in the CSI specification:

  • CreateVolume
  • DeleteVolume
  • ControllerPublishVolume
  • ControllerUnpublishVolume
  • ValidateVolumeCapabilities
  • ListVolumes
  • GetCapacity
  • ControllerGetCapabilities
  • RequiresFSResize
  • ControllerResizeVolume

Demonstration

Let’s demonstrate this feature with a concrete user case.

  • Create storage class for CSI storage provisioner

allowVolumeExpansion: true
apiVersion: storage.k8s.io/v1
kind: StorageClass
metadata:
name: csi-qcfs
parameters:
csiProvisionerSecretName: orain-test
csiProvisionerSecretNamespace: default
provisioner: csi-qcfsplugin
reclaimPolicy: Delete
volumeBindingMode: Immediate

  • Deploy CSI Volume Driver including storage provisioner csi-qcfsplugin across Kubernetes cluster
  • Create PVC qcfs-pvc which will be dynamically provisioned by storage class csi-qcfs

apiVersion: v1
kind: PersistentVolumeClaim
metadata:
name: qcfs-pvc
namespace: default
….
spec:
accessModes:
– ReadWriteOnce
resources:
requests:
storage: 300Gi
storageClassName: csi-qcfs

  • Create MySQL 5.7 instance to use PVC qcfs-pvc
  • In order to mirror the exact same production-level scenario, there are actually two different types of workloads including:
    • Batch insert to make MySQL consuming more file system capacity
    • Surge query request
  • Dynamically expand volume capacity through edit pvc qcfs-pvc configuration

The Prometheus and Grafana integration allows us to visualize corresponding critical metrics.

prometheus grafana

We notice that the middle reading shows MySQL datafile size increasing slowly during bulk inserting. At the same time, the bottom reading shows file system expanding twice in about 20 minutes, from 300 GiB to 400 GiB and then 500 GiB. Meanwhile, the upper reading shows the whole process of expanding volume immediately completes and hardly impacts MySQL QPS.

Conclusion

Regardless of whatever infrastructure applications have been running on, the database is always a critical resource. It is essential to have a more advanced storage subsystem out there to fully support database requirements. This will help drive the more broad adoption of cloud native technology.

Source

Introducing Tarmak – the toolkit for Kubernetes cluster provisioning and management /

By Christian Simon

We are proud to introduce Tarmak, an open source toolkit for Kubernetes cluster lifecycle management that focuses on best practice cluster security, management
and operation. It has been built from the ground-up to be cloud provider-agnostic and provides a means for consistent and reliable cluster deployment and management, across clouds and on-premises environments.

This blog post is a follow-up to a talk Matt
Bates
and I gave at PuppetConf
2017
. The slides can be
found
here
and a recording of the session can be found at the end of this post (click here to watch).

Tarmak logo

Jetstack have extensive experience deploying Kubernetes into production with many different
clients. We have learned what works (and importantly, what works not so well)
and worked through several generations of cluster deployment. In the talk, we described these
challenges. To summarise:

  • Immutable infrastructure isn’t always that desirable.
  • Ability to test and debug is critical for development and operations.
  • Dependencies need to be versioned.
  • Cluster PKI management in dynamic environments is not easy.

Tarmak and its underlying components are the product of Jetstack’s work with
its customers to build and deploy Kubernetes in production at scale.

In this post, we’ll explore the lessons we learned and the motivations for Tarmak, and
dive into the tools and the provisioning mechanics. Firstly, the motivations that were born out of the lessons learned:

Improved developer and operator experience

A major goal for the tooling was to provide an easy-to-use and natural UX – for both
developers and operators.

In previous generations of cluster deployment, one area of concern with immutable
replacement of configuration changes was the long and expensive
feedback loop. It took significant time for a code change to be deployed into a real-world
cluster, and a simple careless mistake in a JSON file could take up to 30 minutes to realise
and fix. Using tests at multiple levels (unit, integration) on all code involved, helps to
catch errors that prevent a cluster from building early.

Another problem, especially with the Bash scripts, was that whilst they would
work fine with one specific configuration, once you had some input
parameters they were really hard to maintain. Scripts were modified and duplicated
and and this quickly became difficult to maintain effectively. So our goal for the new project was
to follow coding best practices: “Don’t repeat yourself”
(DRY) and “Keep it
simple, stupid” (KISS). This
helps to reduce the complexity of later changes and helps to achieve a modular
design.

With replacing instances on every configuration change, it’s not easily possible to
get an idea what changes are about to happen on the instance’s configuration. It
would be great to have better insights into the changes that will be performed, by
having a dry-run capability.

Another important observation was that using a more traditional approach of running
software helps engineers to transition more smoothly into a container-centric
world. Whilst Kubernetes can be used to “self-host” its own components, we recognised
that is greater familiarity (at this stage) with tried-and-tested and traditional tools in
operations teams, so we adopted systemd and use the vanilla open source Kubernetes
binaries.

Less disruptive cluster upgrades

In many cases with existing tooling, cluster upgrades involve replacing instances; when you want to change something, the entire instance is replaced with a new one that contains the new configuration. A number of limitations started to emerge from this strategy.

  • Replacing instances can get time and cost expensive, especially in large clusters.
  • There is no control over our rolled-out instances – their actual state might
    have diverged from the desired state.
  • Draining Kubernetes worker instances is often a quite manual process.
  • Every replacement comes with risks: someone might use latest tags, configuration
    no longer valid.
  • Cached content is lost throughout the whole cluster and needs to be rebuilt.
  • Stateful applications need to migrate data over to other instances (and this is often
    a resource intensive process for some applications).

Tarmak has been designed with these factors in mind. We support both in-place upgrades, as well as full instance replacement. This allows operators to choose how they would like their clusters to be upgraded, to ensure that whatever cluster=level operation they are undertaking, it is performed in the least disruptive way possible.

Consistency between environments

Another benefit of the new tools should be that they should be designed to
provide a consistent deployment across different cloud providers and
on-premises setups. We consistently hear from customers that they do not wish to skill-up
operations teams with a multitide of provisioning tools and techniques, not least because
of the operational risk it poses when trying to reason about cluster configuration and
health at times of failure.

With Tarmak, we have developed the right tool to be able to address these
challenges.

We identified Infrastructure, Configuration and Application as the three core
layers of set-up in a Kubernetes cluster.

  • Infrastructure: all core resources (like compute, network,
    storage) are created and configured to be able to work together. We use
    Terraform to plan and execute these changes. At the end of this stage, the infrastructure is
    ready to run our own bespoke ‘Tarmak instance agent’ (Wing), required for the
    configuration stage.
  • Configuration: The Wing agent is in the core of the configuration layer and
    uses Puppet manifests to configure all instances in a cluster accordingly. After
    Wing has been run it sends reports back to the Wing apiserver, which can be run in
    a highly available configuration. Once all instances in a cluster have successfully
    executed Wing, the Kubernetes cluster is up and running and provides its API as an interface.
  • Applications: The core cluster add-ons are deployed with the help of Puppet. Any other tool
    like kubectl or Helm can also be used to manage the lifecycle of these applications on the
    cluster.

Abstractions and chosen solutions

Abstractions and chosen tools

Infrastructure

As part of the Infrastructure provisioning stage, we use Terraform to set up
instance that later get configured to fulfill one of the following roles:

  • Bastion is the only node that has a public IP address assigned. It is
    used as a “jump host” to connect to services on the private networks of clusters.
    It also runs the Wing apiserver responsible for aggregating the state information of
    instances.
  • Vault instances provide a dynamic CA (Certificate Authority)-as-a-service for the
    various cluster components that rely on TLS authentication. It also runs Consul as a backend
    for Vault and stores its data on persistent disks, encrypted and secured.
  • etcd instances store the state for the Kubernetes control plane. They
    have persistent disks and run etcd HA (i.e. 3+ instances): one for Kubernetes,
    another one dedicated to Kubernetes’ events and the third for the overlay
    network (Calico, by default).
  • Kubernetes Masters are running the Kubernetes control plane components in a highly available
    configuration.
  • Kubernetes Workers are running your organisation’s application workloads.

In addition to the creation of these instances, an object store is populated
with Puppet manifests that are later used to spin up services on the
instances. The same manifests are distributed to all nodes in the cluster.

Infrastructure layer

Infrastructure layer

Configuration

The configuration phase starts when an instance gets started or a re-run is
requested using Tarmak. Wing fetches the latest Puppet manifests from the
object store and applies the manifest on the instance until the manifests have
been converged. Meanwhile, Wing sends status updates to the Wing apiserver.

The Puppet manifests are designed so as not to require Puppet once any required
changes have been applied. The startup of the services are managed using standard
systemd units, and timers are used for recurring tasks like the renewal of
certificates.

The Puppet modules powering these configuration steps have been implemented in
cooperation with Compare the Market — this
should also explain the ‘Meerkats’ in the talk title! 🙂

Configuration layer

Configuration layer

You can get started with Tarmak by following our AWS getting started
guide
.

We’d love to hear feedback and take contributions in the Tarmak project (Apache 2.0 licensed) on GitHub.

We are actively working on making Tarmak more accessible to external
contributors. Our next steps are:

  • Splitting out the Puppet modules into separate repositories.
  • Move issue tracking (GitHub) and CI (Travis CI) out to the open.
  • Improved documentation.

In our next blog post we’ll explain why Tarmak excels at quick and non-disruptive Kubernetes cluster upgrades, using the power of Wing – stay tuned!

Source

From Cattle to K8s – How to Publicly Expose Your Services in Rancher 2.0

Real world applications deployed using containers usually need to allow outside traffic to be routed to the application containers.

Standard ways for providing external access include exposing public ports on the nodes where the application is deployed or placing a load balancer in front of the application containers.

Cattle users on Rancher 1.6 are familiar with port mapping to expose services. In this article, we will explore various options for exposing your Kubernetes workload publicly in Rancher 2.0 using port mapping. Using load balancing solutions is a wide topic and we can look at them separately in later articles.

Port Mapping in Rancher 1.6

Rancher 1.6 enabled users to deploy their containerized apps and expose them publicly via Port Mapping.

Imgur

Users could choose a specific port on the host or let Rancher assign a random one, and that port would be opened for public access. This public port routed traffic to the private port of the service containers running on that host.

Port Mapping in Rancher 2.0

Rancher 2.0 also supports adding port mapping to your workloads deployed on the Kubernetes cluster. These are the options in Kubernetes for exposing a public port for your workload:

  • HostPort
  • NodePort

Imgur

As seen above, the UI for port mapping is pretty similar to the 1.6 experience. Rancher internally adds the necessary Kubernetes HostPort or NodePort specs while creating the deployments for a Kubernetes cluster.

Let’s look at HostPort and NodePort in some detail.

What is a HostPort?

The HostPort setting has to be specified in the Kubernetes YAML specs under the ‘Containers’ section while creating the workload in Kubernetes. Rancher performs this action internally when you select the HostPort for mapping.

When a HostPort is specified, that port is exposed to public access on the host where the pod container is deployed. Traffic hitting at <host IP>:<HostPort> is routed to the pod container’s private port.

Imgur

Here is how the Kubernetes YAML for our Nginx workload specifying the HostPort setting under the ‘ports’ section looks:

apiVersion: apps/v1beta2
kind: Deployment
metadata:
labels:
workload.user.cattle.io/workloadselector: deployment-mystack-nginx
name: nginx
namespace: mystack
spec:
replicas: 1
selector:
matchLabels:
workload.user.cattle.io/workloadselector: deployment-mystack-nginx
template:
metadata:
labels:
workload.user.cattle.io/workloadselector: deployment-mystack-nginx
spec:
affinity: {}
containers:
– image: nginx
imagePullPolicy: Always
name: nginx
ports:
– containerPort: 80
hostPort: 9890
name: 80tcp98900
protocol: TCP
resources: {}
stdin: true
tty: true
dnsPolicy: ClusterFirst
restartPolicy: Always

Using a HostPort for a Kubernetes pod is equivalent to exposing a public port for a Docker container in Rancher 1.6.

HostPort Pros:

  • You can request any available port on the host to be exposed via the HostPort setting.
  • The configuration is simple, and the HostPort setting is placed directly in the Kubernetes pod specs. No other object needs to be created for exposing your application in comparison to a NodePort.

HostPort Cons:

  • Using a HostPort limits the scheduling options for your pod, since only those hosts that have the specified port available can be used for deployment.
  • If the scale of your workload is more than the number of nodes in your Kubernetes cluster, then the deployment will fail.
  • Any two workloads that specify the same HostPort cannot be deployed on the same node.
  • If the host where the pods are running goes down, Kubernetes will have to reschedule the pods to different nodes. Thus, the IP address where your workload is accessible will change, breaking any external clients of your application. The same thing will happen when the pods are restarted, and Kubernetes reschedules them on a different node.

What is a NodePort?

Before we dive into how to create a NodePort for exposing your Kubernetes workload, let’s look at some background on the Kubernetes Service.

Kubernetes Service

A Kubernetes Service is a REST object that abstracts access to Kubernetes pods. The IP address that Kubernetes pods listen to cannot be used as a reliable endpoint for public access to your workload because pods can be destroyed and recreated dynamically, changing their IP address.

A Kubernetes Service provides a static endpoint to the pods. So even if the pods switch IP addresses, external clients that depend on the workload launched over these pods can keep accessing the workload without disruption and without knowledge of the back end pod recreation via the Kubernetes Service interface.

By default, a service is accessible within the Kubernetes cluster on an internal IP. This internal scope is defined using the type parameter of the service spec. So by default for a service, the yaml is type: ClusterIP.

If you want to expose the service outside of the Kubernetes cluster, refer to these ServiceType options in Kubernetes.

One of these types is NodePort, which provides external access to the Kubernetes Service created for your workload pods.

How to define a NodePort

Consider the workload running the image of Nginx again. For this workload, we need to expose the private container port 80 externally.

We can do this by creating a NodePort service for the workload. Here is how a NodePort service spec will look:

apiVersion: v1
kind: Service
metadata:
creationTimestamp: null
name: nginx-nodeport
namespace: mystack
spec:
ports:
– name: 80tcp01
nodePort: 30216
port: 80
protocol: TCP
targetPort: 80
selector:
workload.user.cattle.io/workloadselector: deployment-mystack-nginx
type: NodePort
status:
loadBalancer: {}

If we specify a NodePort service, Kubernetes will allocate a port on every node. The chosen NodePort will be visible in the service spec after creation, as seen above. Alternatively, one can specify a particular port to be used as NodePort in the spec while creating the service. If a specific NodePort is not specified, a port from a range configured on the Kubernetes cluster (default: 30000-32767) will be picked at random.

From outside the Kubernetes cluster, traffic coming to <NodeIP>:<NodePort> will be directed to the workload (kube-proxy component handles this). The NodeIP can be the IP address of any node in your Kubernetes cluster.

Imgur

NodePort Pros:

  • Creating a NodePort service provides a static public endpoint to your workload pods. So even if the pods get dynamically destroyed, Kubernetes can deploy the workload anywhere in the cluster without altering the public endpoint.
  • The scale of the pods is not limited by the number of nodes in the cluster. Nodeport allows decoupling of public access from the number and location of pods.

NodePort Cons:

  • When a NodePort is used, that <NodeIP>:<NodePort> gets reserved in your Kubernetes cluster for every node, even if the workload is never deployed on that node.
  • You can only specify a port from the configured range and not any random port.
  • An extra Kubernetes object (a Kubernetes Service of type NodePort) is needed to expose your workload. Thus, finding out how your application is exposed is not straightforward.

Docker Compose to Kubernetes YAML

The content above is how a Cattle user can add port mapping in the Rancher 2.0 UI, as compared to 1.6. Now lets see how we can do the same via compose files and Rancher CLI.

We can convert the docker-compose.yml file from Rancher 1.6 to Kubernetes YAML using the Kompose tool, and then deploy the application using Rancher CLI in the Kubernetes cluster.

Here is the docker-compose.yml config for the above Nginx service running on 1.6:

version: ‘2’
services:
nginx:
image: nginx
stdin_open: true
tty: true
ports:
– 9890:80/tcp
labels:
io.rancher.container.pull_image: always

Kompose generates the YAML files for the Kubernetes deployment and service objects needed to deploy the Nginx workload in Rancher 2.0. The Kubernetes deployment specs define the pod and container specs, while the service specs define the public access to the pods.

Imgur

Add HostPort via Kompose and Rancher CLI

As seen in the previous article in this blog series, Kompose does not add the required HostPort construct to our deployment specs, even if docker-compose.yml specifies exposed ports. So to replicate the port mapping in a Rancher 2.0 cluster, we can manually add the HostPort construct to the pod container specs in nginx-deployment.yaml and deploy using Rancher CLI.

Imgur

Imgur

Add NodePort via Kompose and Rancher CLI

To add a NodePort service for the deployment via Kompose, the label kompose.service.type should be added to docker-compose.yml file, per the Kompose docs.

version: ‘2’
services:
nginx:
image: nginx
stdin_open: true
tty: true
ports:
– 9890:80/tcp
labels:
io.rancher.container.pull_image: always
kompose.service.type: nodeport

Now running Kompose using docker-compose.yml generates the necessary NodePort service along with the deployment specs. Using Rancher CLI, we could deploy to successfully expose the workload via NodePort.

Imgur

In this article we explored how to use port mapping in Rancher 2.0 to expose the application workloads to public access. The Rancher 1.6 functionality of port mapping can be transitioned to the Kubernetes platform easily. In addition, the Rancher 2.0 UI provides the same intuitive experience for mapping ports while creating or upgrading a workload.

In the upcoming article let’s explore how to monitor the health of your application workloads using Kubernetes and see if the healthcheck support that Cattle provided can be fully migrated to Rancher 2.0!

Prachi Damle

Prachi Damle

Principal Software Engineer

Source

Out of the Clouds onto the Ground: How to Make Kubernetes Production Grade Anywhere

Out of the Clouds onto the Ground: How to Make Kubernetes Production Grade Anywhere

Authors: Steven Wong (VMware), Michael Gasch (VMware)

This blog offers some guidelines for running a production grade Kubernetes cluster in an environment like an on-premise data center or edge location.

What does it mean to be “production grade”?

  • The installation is secure
  • The deployment is managed with a repeatable and recorded process
  • Performance is predictable and consistent
  • Updates and configuration changes can be safely applied
  • Logging and monitoring is in place to detect and diagnose failures and resource shortages
  • Service is “highly available enough” considering available resources, including constraints on money, physical space, power, etc.
  • A recovery process is available, documented, and tested for use in the event of failures

In short, production grade means anticipating accidents and preparing for recovery with minimal pain and delay.

This article is directed at on-premise Kubernetes deployments on a hypervisor or bare-metal platform, facing finite backing resources compared to the expansibility of the major public clouds. However, some of these recommendations may also be useful in a public cloud if budget constraints limit the resources you choose to consume.

A single node bare-metal Minikube deployment may be cheap and easy, but is not production grade. Conversely, you’re not likely to achieve Google’s Borg experience in a retail store, branch office, or edge location, nor are you likely to need it.

This blog offers some guidance on achieving a production worthy Kubernetes deployment, even when dealing with some resource constraints.

without incidence

Critical components in a Kubernetes cluster

Before we dive into the details, it is critical to understand the overall Kubernetes architecture.

A Kubernetes cluster is a highly distributed system based on a control plane and clustered worker node architecture as depicted below.

api server

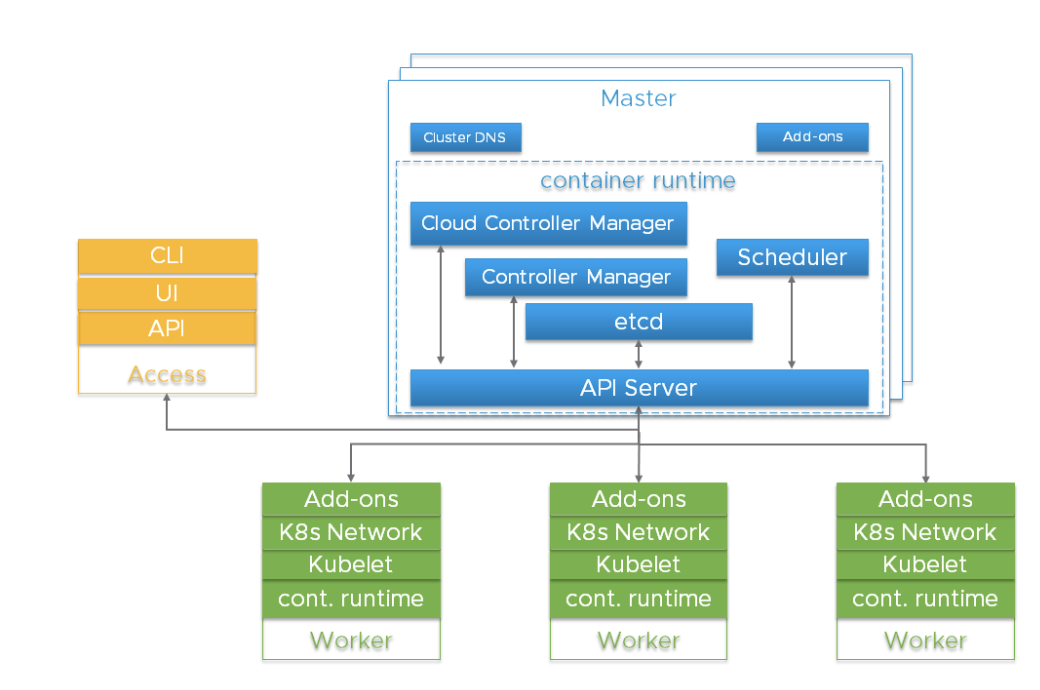
Typically the API server, Controller Manager and Scheduler components are co-located within multiple instances of control plane (aka Master) nodes. Master nodes usually include etcd too, although there are high availability and large cluster scenarios that call for running etcd on independent hosts. The components can be run as containers, and optionally be supervised by Kubernetes, i.e. running as statics pods.

For high availability, redundant instances of these components are used. The importance and required degree of redundancy varies.

Kubernetes components from an HA perspective

kubernetes components HA

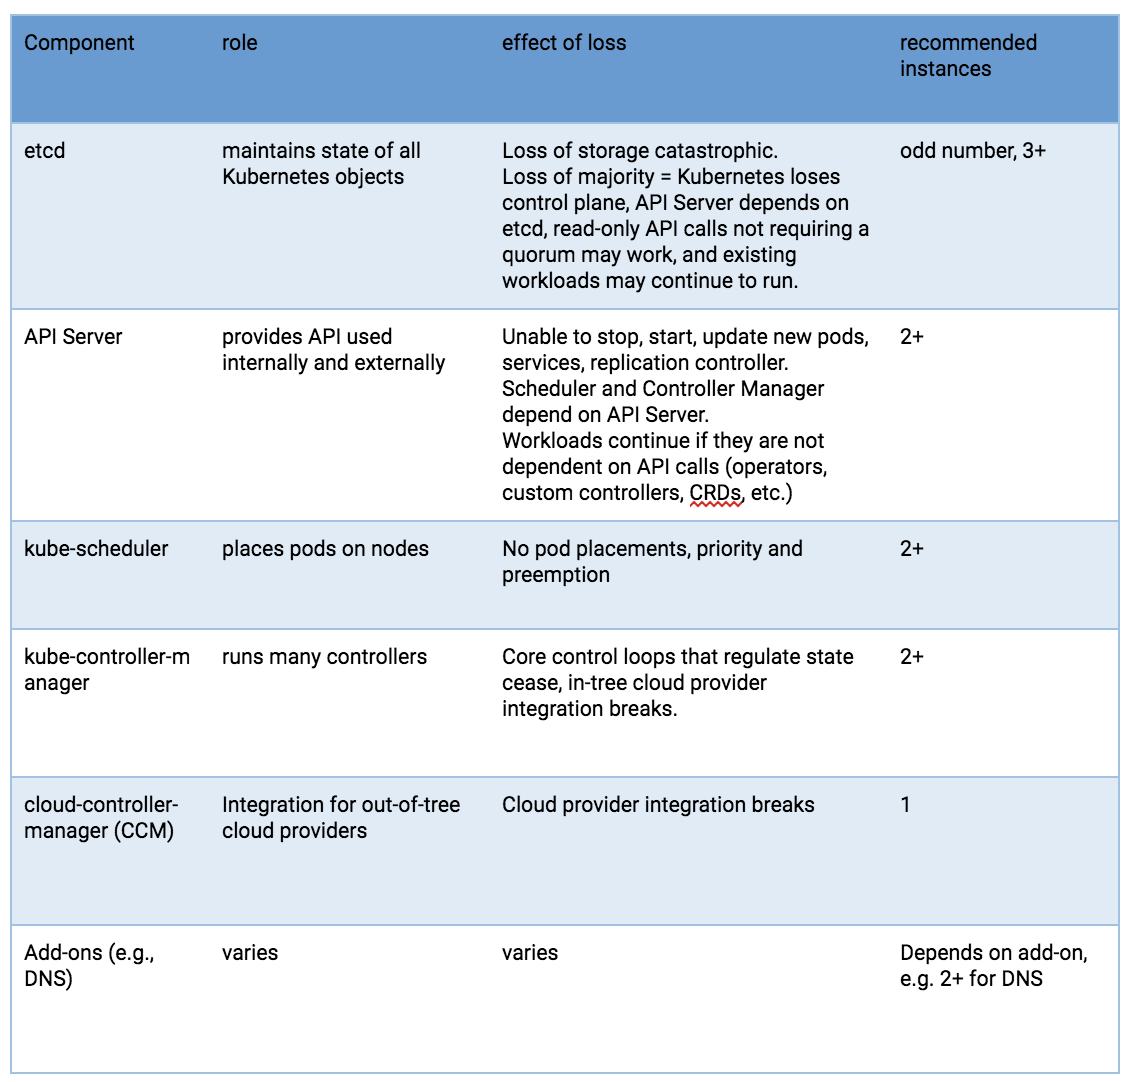
Risks to these components include hardware failures, software bugs, bad updates, human errors, network outages, and overloaded systems resulting in resource exhaustion. Redundancy can mitigate the impact of many of these hazards. In addition, the resource scheduling and high availability features of a hypervisor platform can be useful to surpass what can be achieved using the Linux operating system, Kubernetes, and a container runtime alone.

The API Server uses multiple instances behind a load balancer to achieve scale and availability. The load balancer is a critical component for purposes of high availability. Multiple DNS API Server ‘A’ records might be an alternative if you don’t have a load balancer.

The kube-scheduler and kube-controller-manager engage in a leader election process, rather than utilizing a load balancer. Since a cloud-controller-manager is used for selected types of hosting infrastructure, and these have implementation variations, they will not be discussed, beyond indicating that they are a control plane component.

Pods running on Kubernetes worker nodes are managed by the kubelet agent. Each worker instance runs the kubelet agent and a CRI-compatible container runtime. Kubernetes itself is designed to monitor and recover from worker node outages. But for critical workloads, hypervisor resource management, workload isolation and availability features can be used to enhance availability and make performance more predictable.

etcd

etcd is the persistent store for all Kubernetes objects. The availability and recoverability of the etcd cluster should be the first consideration in a production-grade Kubernetes deployment.

A five-node etcd cluster is a best practice if you can afford it. Why? Because you could engage in maintenance on one and still tolerate a failure. A three-node cluster is the minimum recommendation for production-grade service, even if only a single hypervisor host is available. More than seven nodes is not recommended except for very large installations straddling multiple availability zones.

The minimum recommendation for hosting an etcd cluster node is 2GB of RAM with 8GB of SSD-backed disk. Usually, 8GB RAM and a 20GB disk will be enough. Disk performance affects failed node recovery time. See https://coreos.com/etcd/docs/latest/op-guide/hardware.html for more on this.

Consider multiple etcd clusters in special situations

For very large Kubernetes clusters, consider using a separate etcd cluster for Kubernetes events so that event storms do not impact the main Kubernetes API service. If you use flannel networking, it retains configuration in etcd and may have differing version requirements than Kubernetes, which can complicate etcd backup – consider using a dedicated etcd cluster for flannel.

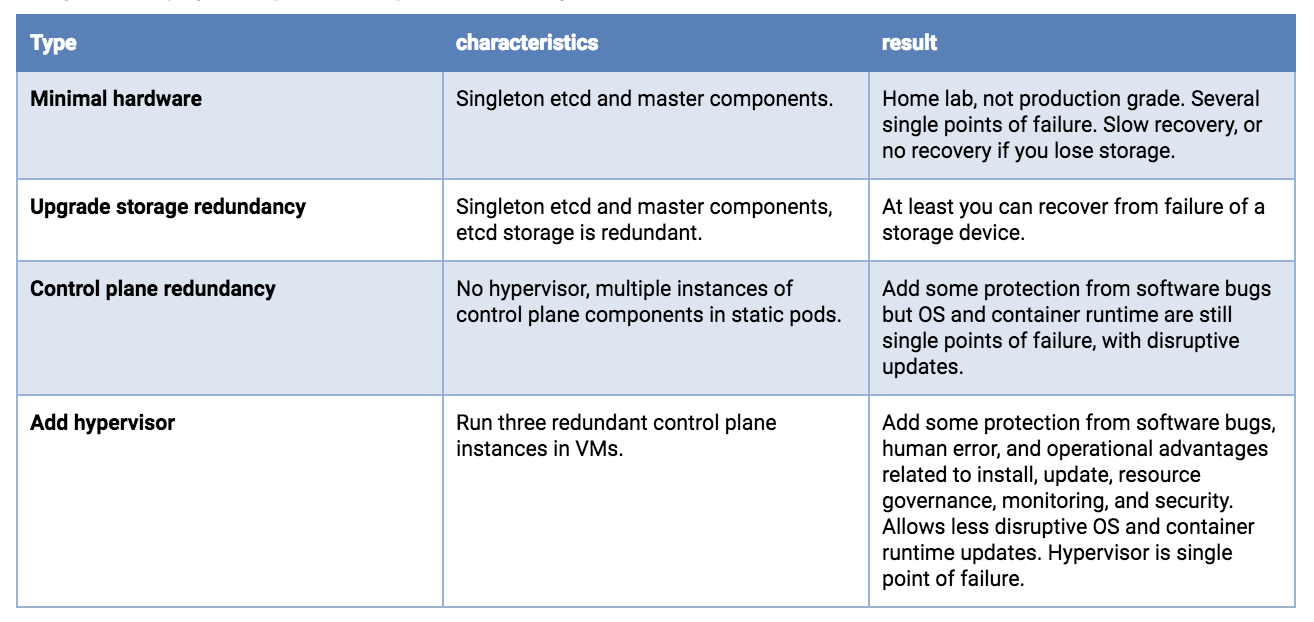
Single host deployments

The availability risk list includes hardware, software and people. If you are limited to a single host, the use of redundant storage, error-correcting memory and dual power supplies can reduce hardware failure exposure. Running a hypervisor on the physical host will allow operation of redundant software components and add operational advantages related to deployment, upgrade, and resource consumption governance, with predictable and repeatable performance under stress. For example, even if you can only afford to run singletons of the master services, they need to be protected from overload and resource exhaustion while competing with your application workload. A hypervisor can be more effective and easier to manage than configuring Linux scheduler priorities, cgroups, Kubernetes flags, etc.

If resources on the host permit, you can deploy three etcd VMs. Each of the etcd VMs should be backed by a different physical storage device, or they should use separate partitions of a backing store using redundancy (mirroring, RAID, etc).

Dual redundant instances of the API server, scheduler and controller manager would be the next upgrade, if your single host has the resources.

Single host deployment options, least production worthy to better

single host deployment

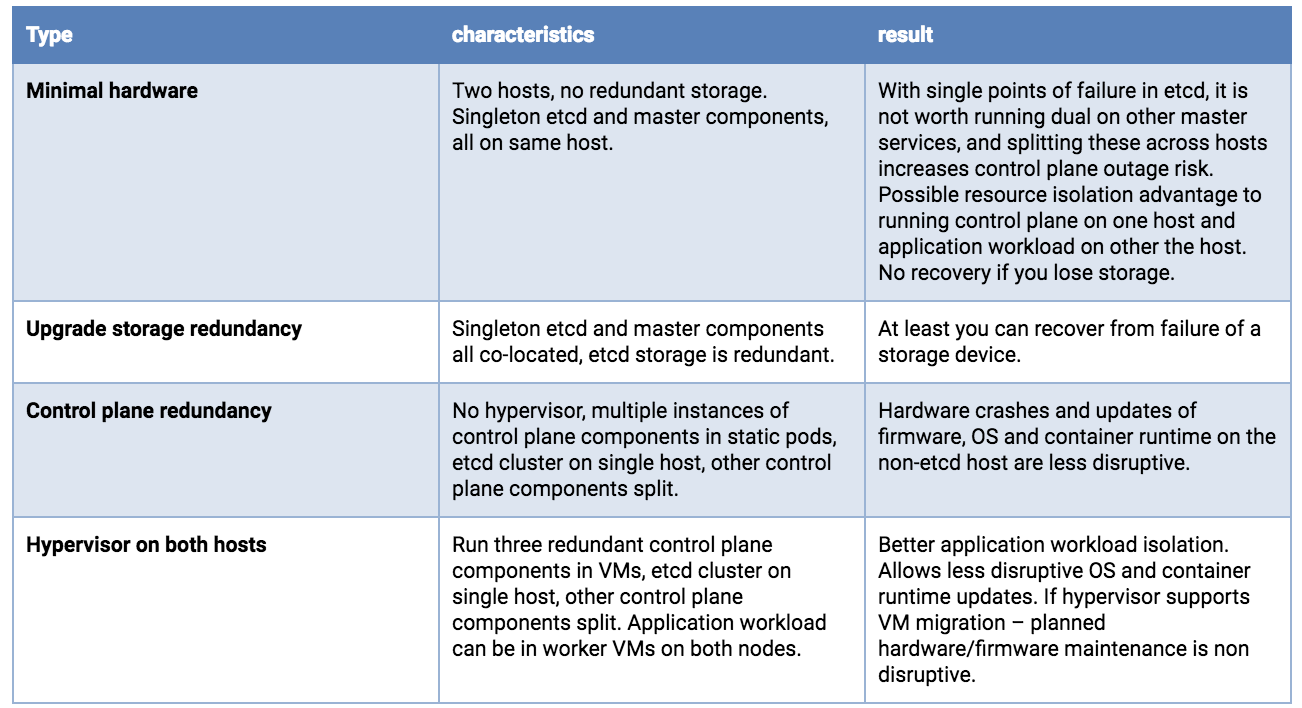
Dual host deployments

With two hosts, storage concerns for etcd are the same as a single host, you want redundancy. And you would preferably run 3 etcd instances. Although possibly counter-intuitive, it is better to concentrate all etcd nodes on a single host. You do not gain reliability by doing a 2+1 split across two hosts – because loss of the node holding the majority of etcd instances results in an outage, whether that majority is 2 or 3. If the hosts are not identical, put the whole etcd cluster on the most reliable host.

Running redundant API Servers, kube-schedulers, and kube-controller-managers is recommended. These should be split across hosts to minimize risk due to container runtime, OS and hardware failures.

Running a hypervisor layer on the physical hosts will allow operation of redundant software components with resource consumption governance, and can have planned maintenance operational advantages.

Dual host deployment options, least production worthy to better

dual host deployment

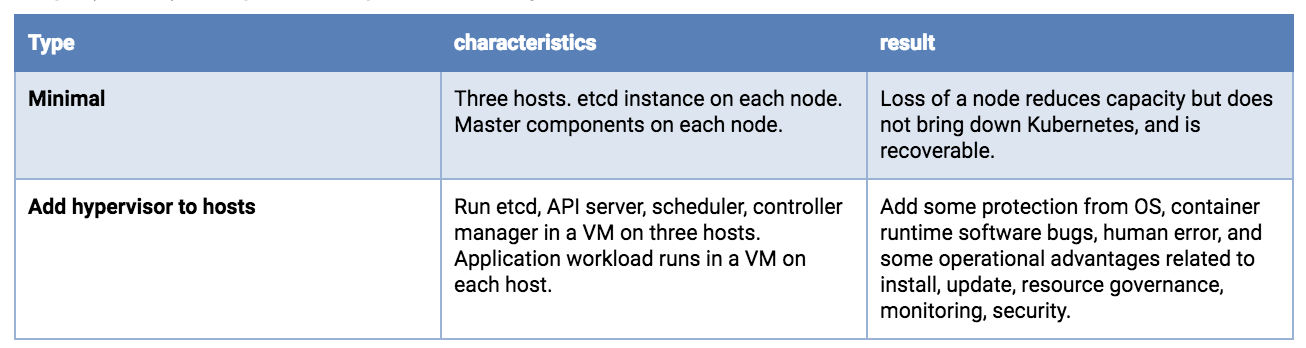
Triple (or larger) host deployments – Moving into uncompromised production-grade service
Splitting etcd across three hosts is recommended. A single hardware failure will reduce application workload capacity, but should not result in a complete service outage.

With very large clusters, more etcd instances will be required.

Running a hypervisor layer offers operational advantages and better workload isolation. It is beyond the scope of this article, but at the three-or-more host level, advanced features may be available (clustered redundant shared storage, resource governance with dynamic load balancing, automated health monitoring with live migration or failover).

Triple (or more) host options, least production worthy to better

triple host deployment

Kubernetes configuration settings

Master and Worker nodes should be protected from overload and resource exhaustion. Hypervisor features can be used to isolate critical components and reserve resources. There are also Kubernetes configuration settings that can throttle things like API call rates and pods per node. Some install suites and commercial distributions take care of this, but if you are performing a custom Kubernetes deployment, you may find that the defaults are not appropriate, particularly if your resources are small or your cluster is large.

Resource consumption by the control plane will correlate with the number of pods and the pod churn rate. Very large and very small clusters will benefit from non-default settings of kube-apiserver request throttling and memory. Having these too high can lead to request limit exceeded and out of memory errors.

On worker nodes, Node Allocatable should be configured based on a reasonable supportable workload density at each node. Namespaces can be created to subdivide the worker node cluster into multiple virtual clusters with resource CPU and memory quotas. Kubelet handling of out of resource conditions can be configured.

Security

Every Kubernetes cluster has a cluster root Certificate Authority (CA). The Controller Manager, API Server, Scheduler, kubelet client, kube-proxy and administrator certificates need to be generated and installed. If you use an install tool or a distribution this may be handled for you. A manual process is described here. You should be prepared to reinstall certificates in the event of node replacements or expansions.

As Kubernetes is entirely API driven, controlling and limiting who can access the cluster and what actions they are allowed to perform is essential. Encryption and authentication options are addressed in this documentation.

Kubernetes application workloads are based on container images. You want the source and content of these images to be trustworthy. This will almost always mean that you will host a local container image repository. Pulling images from the public Internet can present both reliability and security issues. You should choose a repository that supports image signing, security scanning, access controls on pushing and pulling images, and logging of activity.

Processes must be in place to support applying updates for host firmware, hypervisor, OS, Kubernetes, and other dependencies. Version monitoring should be in place to support audits.

Recommendations:

  • Tighten security settings on the control plane components beyond defaults (e.g., locking down worker nodes)
  • Utilize Pod Security Policies
  • Consider the NetworkPolicy integration available with your networking solution, including how you will accomplish tracing, monitoring and troubleshooting.
  • Use RBAC to drive authorization decisions and enforcement.
  • Consider physical security, especially when deploying to edge or remote office locations that may be unattended. Include storage encryption to limit exposure from stolen devices and protection from attachment of malicious devices like USB keys.
  • Protect Kubernetes plain-text cloud provider credentials (access keys, tokens, passwords, etc.)

Kubernetes secret objects are appropriate for holding small amounts of sensitive data. These are retained within etcd. These can be readily used to hold credentials for the Kubernetes API but there are times when a workload or an extension of the cluster itself needs a more full-featured solution. The HashiCorp Vault project is a popular solution if you need more than the built-in secret objects can provide.

Disaster Recovery and Backup

disaster recovery

Utilizing redundancy through the use of multiple hosts and VMs helps reduce some classes of outages, but scenarios such as a sitewide natural disaster, a bad update, getting hacked, software bugs, or human error could still result in an outage.

A critical part of a production deployment is anticipating a possible future recovery.

It’s also worth noting that some of your investments in designing, documenting, and automating a recovery process might also be re-usable if you need to do large-scale replicated deployments at multiple sites.

Elements of a DR plan include backups (and possibly replicas), replacements, a planned process, people who can carry out the process, and recurring training. Regular test exercises and chaos engineering principles can be used to audit your readiness.

Your availability requirements might demand that you retain local copies of the OS, Kubernetes components, and container images to allow recovery even during an Internet outage. The ability to deploy replacement hosts and nodes in an “air-gapped” scenario can also offer security and speed of deployment advantages.

All Kubernetes objects are stored on etcd. Periodically backing up the etcd cluster data is important to recover Kubernetes clusters under disaster scenarios, such as losing all master nodes.

Backing up an etcd cluster can be accomplished with etcd’s built-in snapshot mechanism, and copying the resulting file to storage in a different failure domain. The snapshot file contains all the Kubernetes states and critical information. In order to keep the sensitive Kubernetes data safe, encrypt the snapshot files.

Using disk volume based snapshot recovery of etcd can have issues; see #40027. API-based backup solutions (e.g., Ark) can offer more granular recovery than a etcd snapshot, but also can be slower. You could utilize both snapshot and API-based backups, but you should do one form of etcd backup as a minimum.

Be aware that some Kubernetes extensions may maintain state in independent etcd clusters, on persistent volumes, or through other mechanisms. If this state is critical, it should have a backup and recovery plan.

Some critical state is held outside etcd. Certificates, container images, and other configuration- and operation-related state may be managed by your automated install/update tooling. Even if these items can be regenerated, backup or replication might allow for faster recovery after a failure. Consider backups with a recovery plan for these items:

  • Certificate and key pairs
    • CA
    • API Server
    • Apiserver-kubelet-client
    • ServiceAccount signing
    • “Front proxy”
    • Front proxy client
  • Critical DNS records
  • IP/subnet assignments and reservations
  • External load-balancers
  • kubeconfig files
  • LDAP or other authentication details
  • Cloud provider specific account and configuration data

Considerations for your production workloads

Anti-affinity specifications can be used to split clustered services across backing hosts, but at this time the settings are used only when the pod is scheduled. This means that Kubernetes can restart a failed node of your clustered application, but does not have a native mechanism to rebalance after a fail back. This is a topic worthy of a separate blog, but supplemental logic might be useful to achieve optimal workload placements after host or worker node recoveries or expansions. The Pod Priority and Preemption feature can be used to specify a preferred triage in the event of resource shortages caused by failures or bursting workloads.

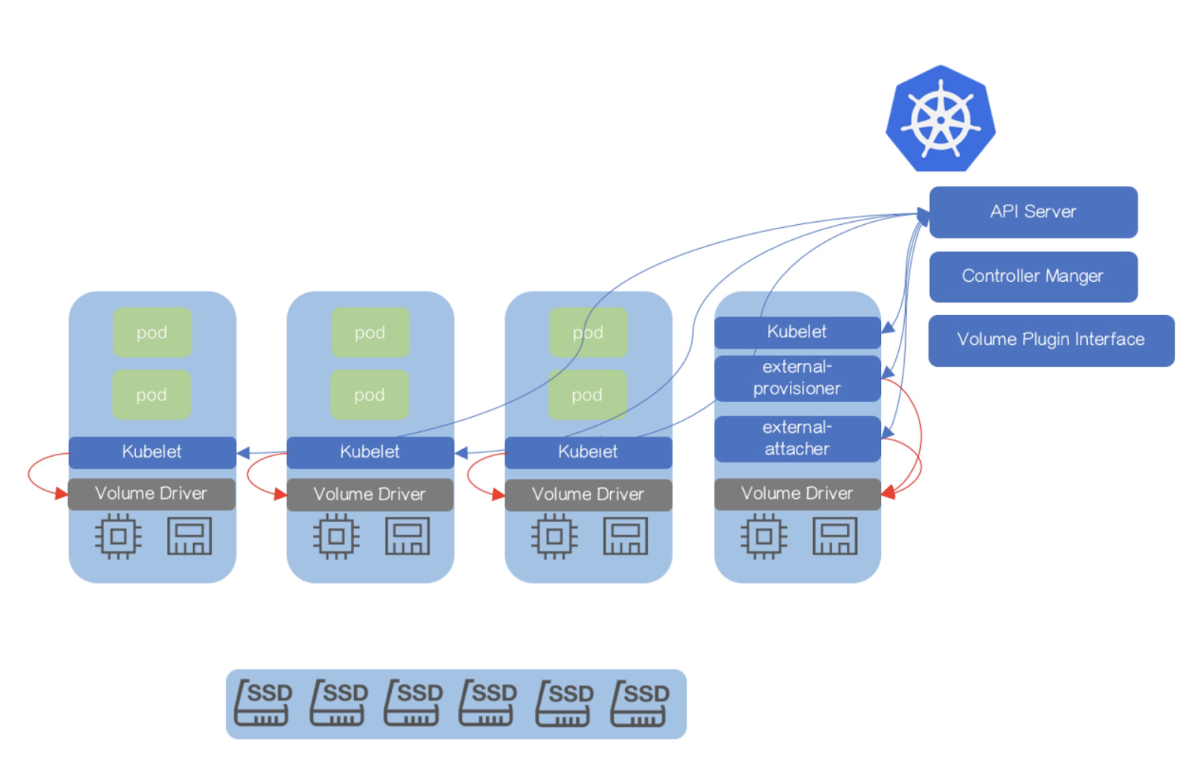
For stateful services, external attached volume mounts are the standard Kubernetes recommendation for a non-clustered service (e.g., a typical SQL database). At this time Kubernetes managed snapshots of these external volumes is in the category of a roadmap feature request, likely to align with the Container Storage Interface (CSI) integration. Thus performing backups of such a service would involve application specific, in-pod activity that is beyond the scope of this document. While awaiting better Kubernetes support for a snapshot and backup workflow, running your database service in a VM rather than a container, and exposing it to your Kubernetes workload may be worth considering.

Cluster-distributed stateful services (e.g., Cassandra) can benefit from splitting across hosts, using local persistent volumes if resources allow. This would require deploying multiple Kubernetes worker nodes (could be VMs on hypervisor hosts) to preserve a quorum under single point failures.

Other considerations

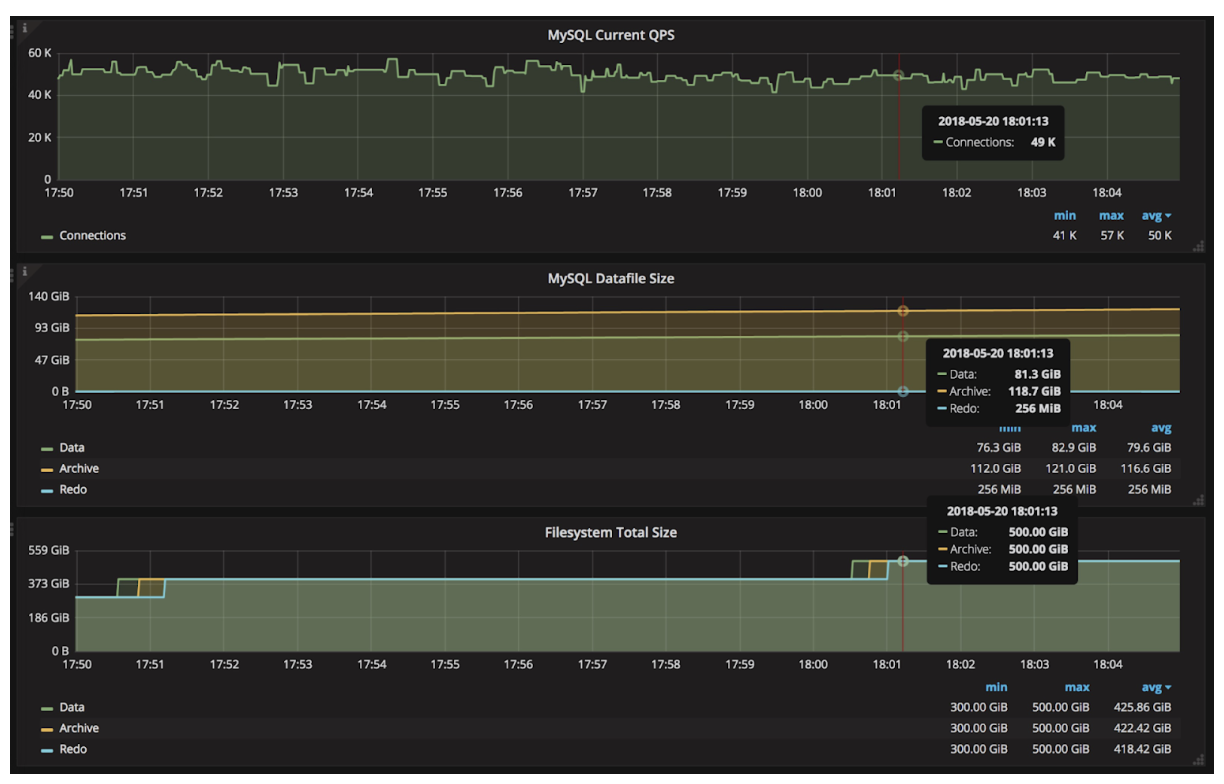
Logs and metrics (if collected and persistently retained) are valuable to diagnose outages, but given the variety of technologies available it will not be addressed in this blog. If Internet connectivity is available, it may be desirable to retain logs and metrics externally at a central location.

Your production deployment should utilize an automated installation, configuration and update tool (e.g., Ansible, BOSH, Chef, Juju, kubeadm, Puppet, etc.). A manual process will have repeatability issues, be labor intensive, error prone, and difficult to scale. Certified distributions are likely to include a facility for retaining configuration settings across updates, but if you implement your own install and config toolchain, then retention, backup and recovery of the configuration artifacts is essential. Consider keeping your deployment components and settings under a version control system such as Git.

Outage recovery

Runbooks documenting recovery procedures should be tested and retained offline – perhaps even printed. When an on-call staff member is called up at 2 am on a Friday night, it may not be a great time to improvise. Better to execute from a pre-planned, tested checklist – with shared access by remote and onsite personnel.

Final thoughts

airplane

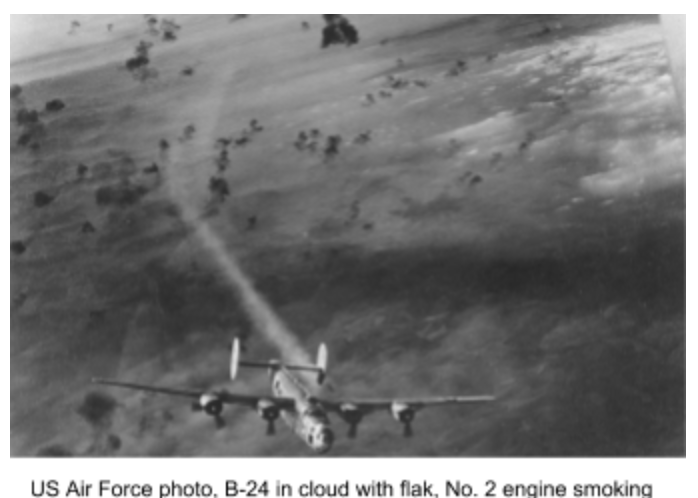
Buying a ticket on a commercial airline is convenient and safe. But when you travel to a remote location with a short runway, that commercial Airbus A320 flight isn’t an option. This doesn’t mean that air travel is off the table. It does mean that some compromises are necessary.

The adage in aviation is that on a single engine aircraft, an engine failure means you crash. With twin engines, at the very least, you get more choices of where you crash. Kubernetes on a small number of hosts is similar, and if your business case justifies it, you might scale up to a larger fleet of mixed large and small vehicles (e.g., FedEx, Amazon).

Those designing a production-grade Kubernetes solution have a lot of options and decisions. A blog-length article can’t provide all the answers, and can’t know your specific priorities. We do hope this offers a checklist of things to consider, along with some useful guidance. Some options were left “on the cutting room floor” (e.g., running Kubernetes components using self-hosting instead of static pods). These might be covered in a follow up if there is interest. Also, Kubernetes’ high enhancement rate means that if your search engine found this article after 2019, some content might be past the “sell by” date.

Source

A Day in the Life of a Jetstack Solutions Engineer // Jetstack Blog

By Hannah Morris

Solutions Engineer Luke provides an insight into what it’s like to work on Kubernetes projects with Jetstack.

What made you want to work for Jetstack?

I wanted to work for Jetstack because they offered me the opportunity to work on a variety of different projects, both with private clients and in open source.

On one hand, I provide consultation for customers about Kubernetes best practices, and run workshops with Google to teach those who are relatively new to Kubernetes about the various tools available within the software.

On the other hand, the general consensus at Jetstack is that contributing to open source is very important. Whenever we feel we have a product that would be valuable to the community, we all try our best to get it out into the open.

I also liked the company’s openness to new technologies: they aren’t restricted to a certain type of toolset, so I knew that working with them would give me the opportunity to be more experimental. I felt that I could learn a lot whilst working for Jetstack.

ContainerCamp

The two Matts, James and Luke at Container Camp 2017

Had you previously worked with Kubernetes?

Before joining Jetstack, I didn’t have any production experience with Kubernetes. My prior experience with Kubernetes was solely my personal interest in the technology: I ran clusters at home and experimented with the different set ups.

What support do you receive whilst working?

The key underlying aspect of the Jetstack team is that we are all very enthusiastic about Kubernetes and are eager to learn. In my opinion, this has a big impact on the team’s ethos, in that everyone is willing to help with problems faced by others. This really does make a big difference when you’re trying to solve a particularly difficult issue. For any task, support is readily available, as those who are more experienced in particular areas are always on hand to answer questions and guide those who are newer to the concepts.

Do you have the freedom to work alone?

I really value that Jetstack gives me the opportunity to work alone for periods of time, and properly get my teeth into problems. We divide tasks so that we are able to work independently, and then sync up to discuss any issues. A great thing I’ve noticed since starting is the amount of freedom I’ve been given: I feel that I can suggest things to work on, and I will often be given the time to explore them.

pusher training

Hannah, James and Luke at a recent training workshop with a customer

What does your daily routine consist of as a Jetstack engineer?

It depends: if I am doing consulting work, or running workshops, I usually spend a whole day on site with a client, or at a Google training venue. For internal projects, timings are very flexible: I personally like to spend the morning working at home, and when I feel I’m at a good stage in my work, or need to discuss something with my colleagues, I usually work from the office from midday. At Jetstack we are given the flexibility to work from wherever suits us best.

In your opinion, what makes Jetstack unique as a company?

I think for me one of the main benefits of working at Jetstack is feeling that the work I do makes an impact in the company as a whole. I’ve previously worked for large companies where it can be hard to really see where your efforts go in some cases. At Jetstack you can directly see the impact your work has on clients and open source projects. It makes you feel valued, and, as a result, much more motivated.

Describe the Jetstack team atmosphere.

As I’ve mentioned, all those in the team are enthusiastic about their work, and so are keen to help out in all aspects of the company. Although we work across different offices and remotely, we often come together to catch up and socialise. We recently had an offsite trip to Wales in September, and try and organise regular visits to each office (London, Bristol and Birmingham).

jetstack beach

Jetstack offsite in Swansea, September 2017

Join us at Jetstack!

Join a company that brings you into the best Kubernetes projects on the planet. We offer flexible hours, varied and interesting work, and a chance to learn from, and share knowledge with, the leaders in their field.

hello@jetstack.io

Source

Flexible software deployment patterns with IngressRoute

This is the third post in a series highlighting some of the exciting new features released in Heptio Contour version 0.6. If you missed out on those, start with Introducing Heptio Contour 0.6 and Improving the multi-team Kubernetes ingress experience with Heptio Contour 0.6.

One of the improvements that we added to IngressRoute is the ability to route traffic to multiple Services for a given path as well as apply weights to those upstream Services. This seemingly small addition allows users to implement some simple, yet very powerful deployment patterns.

Canary Deployments

One way to roll out a new version of an application is to utilize a canary deployment. In this model, first deploy the change to a small subset of users to gather information on how the new version is responding. Since only a small set of traffic is targeted, the impact overall will not be as apparent in the event of a failure of the new version. The amount of traffic sent to the canary version is determined by the weight configured, a higher proportion of weight means more traffic will be sent.

Without IngressRoute, the only way to implement this would be to have a Service select pods from two different deployments, however, traffic would be limited by the number of replicas of each deployment and it would be difficult to manage. Additionally, the standard Kubernetes Ingress object does not allow for multiple Services per virtual host and does not support configurable weighting.

We took these requirements into account as we designed the IngressRoute specification and added the ability to define multiple Services per Route as well as configurable weighting. By manipulating weights across the Services, the entire rollout can be managed easily until the new version of the application is receiving 100% of the traffic.

Following is a diagram which visualizes how a canary deployment is rolled out:

apiVersion: contour.heptio.com/v1beta1
kind: IngressRoute
metadata:
name: production-webapp
spec:
virtualhost:
fqdn: foo.com
routes:
– match: /
services:
– name: webapp-v1.0.0
port: 80
weight: 90
– name: webapp-v1.1.0
port: 80
weight: 10

In this example, 90% of the requests to foo.com are routed to the Service webapp-v1.0.0 and 10% are routed to webapp-v1.1.0. It’s important to note that modifying the weights triggers an immediate shift of traffic pattern in Envoy (via Contour).

Other Use-Cases

Heptio Gimbal is an open source initiative that builds on Heptio Contour with the goal of unifying and managing internet traffic on hybrid environments consisting of multiple Kubernetes clusters running on cloud providers and on traditional data centers.

Gimbal allows users to utilize multi-service IngressRoutes to route traffic across clusters. You can read more about Gimbal from our launch blog post.

What’s next?

In this post, we have explored how traffic can be routed to multiple weighted Services within a Kubernetes cluster utilizing IngressRoute. This is one of the many exciting features available in the latest version of Heptio Contour.

In future posts, we will explore other patterns enabled by the IngressRoute, including blue/green deployments and load balancing strategies. If you have any questions or are interested in learning more, reach us via the #contour channel on the Kubernetes community Slack or follow us on Twitter.

Source

From Cattle to K8s – Application Healthchecks in Rancher 2.0

How to Migrate from Rancher 1.6 to Rancher 2.1 Online Meetup

Key terminology differences, implementing key elements, and transforming Compose to YAML

Watch the video

When your application is user-facing, ensuring continuous availability and minimal downtime is a challenge. Hence, monitoring the health of the application is essential to avoid any outages.

HealthChecks in Rancher 1.6

Cattle provided the ability to add HTTP or TCP healthchecks for the deployed services in Rancher 1.6. Healthcheck support is provided by Rancher’s own healthcheck microservice. You can read more about it here.

In brief, a Cattle user can add a TCP healthcheck to a service. Rancher’s healthcheck containers, which are launched on a different host, will test if a TCP connection opens at the specified port for the service containers. Note that with the latest release (v1.6.20), healthcheck containers are also scheduled on the same host as the service containers, along with other hosts.

HTTP healthchecks can also be added while deploying services. You can ask Rancher to make an HTTP request at a specified path and specify what response is expected.

These healthchecks are done periodically at a configurable interval, and retries/timeouts are also configurable. Upon failing a healthcheck, you can also instruct Rancher if and when the container should be recreated.

Consider a service running an Nginx image on Cattle, with an HTTP healthcheck configured as below.

Imgur

The healthcheck parameters appear in the rancher-compose.yml file and not the docker-compose.yml because healthcheck functionality is implemented by Rancher.

Imgur

Lets see if we can configure corresponding healthchecks in Rancher 2.0.

HealthChecks in Rancher 2.0

In 2.0, Rancher uses the native Kubernetes healthcheck mechanisms: livenessProbe and readinessProbe.

As documented here, probes are diagnostics performed periodically by the Kubelet on a container. In Rancher 2.0, healthchecks are done by the Kubelet running locally, as compared to the cross-host healthchecks in Rancher 1.6.

A Quick Kubernetes Healthcheck Summary

  • livenessProbe

    A livenessProbe is an action performed on a container to check if the container is running. If the probe reports failure, Kubernetes will kill the pod container, and it is restarted as per the restart policy specified in the specs.

  • readinessProbe

    A readinessProbe is used to check if a container is ready to accept and serve requests. When a readinessProbe fails, the pod container is not exposed via the public endpoints so that no requests are made to the container.

    If your workload is busy doing some startup routine before it can serve requests, it is a good idea to configure a readinessProbe for the workload.

The following types of livenessProbe and readinessProbe can be configured for Kubernetes workloads:

  • tcpSocket – the Kubelet checks if TCP connections can be opened against the container’s IP address on a specified port.
  • httpGet – An HTTP/HTTPS GET request is made at the specified path and reported as successful if it returns a HTTP response code within 200 and 400.
  • exec – the Kubelet executes a specified command inside the container and checks if the command exits with status 0.

More configuration details for the above probes can be found here.

Configuring Healthchecks in Rancher 2.0

Via Rancher UI, users can add TCP or HTTP healthchecks to Kubernetes workloads. By default, Rancher asks you to configure a readinessProbe for the workload and applies a livenessProbe using the same configuration. You can choose to define a separate livenessProbe.

If the healthchecks fail, the container is restarted per the restartPolicy defined in the workload specs. This is equivalent to the strategy parameter in rancher-compose.yml files for 1.6 services using healthchecks in Cattle.

TCP Healthcheck

While deploying a workload in Rancher 2.0, users can configure TCP healthchecks to check if a TCP connection can be opened at a specific port.

Imgur

Here are the Kubernetes YAML specs showing the TCP readinessProbe configured for the Nginx workload as shown above. Rancher also adds a livenessProbe to your workload using the same config.

Imgur

Healthcheck parameters from 1.6 to 2.0:

  • port maps to tcpSocket.port
  • response_timeout maps to timeoutSeconds
  • healthy_threshold maps to failureThreshold
  • unhealthy_threshold maps to successThreshold
  • interval maps to periodSeconds
  • initializing_timeout maps to initialDelaySeconds
  • strategy maps to restartPolicy

HTTP Healthcheck

You can also specify an HTTP healthcheck and provide a path in the pod container at which HTTP/HTTPS GET requests will be made by the Kubelet. However, Kubernetes only supports an HTTP/HTTPS GET request, unlike any HTTP method supported by healthchecks in Rancher 1.6.

Imgur

Here are the Kubernetes YAML specs showing the HTTP readinessProbe and livenessProbe configured for the Nginx workload as shown above.

Imgur

Healthcheck in Action

Now let’s see what happens when a healthcheck fails and how the workload recovers in Kubernetes.

Consider the above HTTP healthcheck on our Nginx workload doing an HTTP GET on the /index.html path.
To make the healthcheck fail, I did a exec into the pod container using the Execute Shell UI option in Rancher.

Imgur

Once I exec’ed to the container, I moved the file that the healthcheck does a GET on.

Imgur

The readinessProbe and livenessProbe check failed, and the workload status changed to unavailable.

Imgur

The pod was killed and recreated soon by Kubernetes, and the workload came back up since the restartPolicy was set to Always.

Using Kubectl, you can see these healthcheck event logs.

Imgur

Imgur

As a quick tip, the Rancher 2.0 UI provides the helpful option to Launch Kubectl from the Kubernetes Cluster view, where you can run native Kubernetes commands on the cluster objects.

Migrate Healthchecks via Docker Compose to Kubernetes Yaml?

Rancher 1.6 provided healthchecks via its own microservice, which is why the healthcheck parameters that a Cattle user added to the services appear in the rancher-compose.yml file and not in the docker-compose.yml config file. The Kompose tool we used earlier in this blog series works on standard docker-compose.yml parameters and therefore cannot parse the Rancher healthcheck constructs. So as of now, we cannot use this tool for converting the Rancher healthchecks from compose config to Kubernetes Yaml.

Conclusion

As seen in this blog post, the configuration parameters available to add TCP or HTTP healthchecks in Rancher 2.0 are very similar to Rancher 1.6. The healthcheck config used by Cattle services can be transitioned completely to 2.0 without loss of any functionality.

In the upcoming article, I plan to explore how to map scheduling options that Cattle supports to Kubernetes in Rancher 2.0. Stay tuned!

Prachi Damle

Prachi Damle

Principal Software Engineer

Source

Introducing Kubebuilder: an SDK for building Kubernetes APIs using CRDs

Author: Phillip Wittrock (Google), Sunil Arora (Google)

How can we enable applications such as MySQL, Spark and Cassandra to manage themselves just like Kubernetes Deployments and Pods do? How do we configure these applications as their own first class APIs instead of a collection of StatefulSets, Services, and ConfigMaps?

We have been working on a solution and are happy to introduce kubebuilder, a comprehensive development kit for rapidly building and publishing Kubernetes APIs and Controllers using CRDs. Kubebuilder scaffolds projects and API definitions and is built on top of the controller-runtime libraries.

Why Kubebuilder and Kubernetes APIs?

Applications and cluster resources typically require some operational work – whether it is replacing failed replicas with new ones, or scaling replica counts while resharding data. Running the MySQL application may require scheduling backups, reconfiguring replicas after scaling, setting up failure detection and remediation, etc.

With the Kubernetes API model, management logic is embedded directly into an application specific Kubernetes API, e.g. a “MySQL” API. Users then declaratively manage the application through YAML configuration using tools such as kubectl, just like they do for Kubernetes objects. This approach is referred to as an Application Controller, also known as an Operator. Controllers are a powerful technique backing the core Kubernetes APIs that may be used to build many kinds of solutions in addition to Applications; such as Autoscalers, Workload APIs, Configuration APIs, CI/CD systems, and more.

However, while it has been possible for trailblazers to build new Controllers on top of the raw API machinery, doing so has been a DIY “from scratch” experience, requiring developers to learn low level details about how Kubernetes libraries are implemented, handwrite boilerplate code, and wrap their own solutions for integration testing, RBAC configuration, documentation, etc. Kubebuilder makes this experience simple and easy by applying the lessons learned from building the core Kubernetes APIs.

Getting Started Building Application Controllers and Kubernetes APIs

By providing an opinionated and structured solution for creating Controllers and Kubernetes APIs, developers have a working “out of the box” experience that uses the lessons and best practices learned from developing the core Kubernetes APIs. Creating a new “Hello World” Controller with kubebuilder is as simple as:

  1. Create a project with kubebuilder init
  2. Define a new API with kubebuilder create api
  3. Build and run the provided main function with make install & make run

This will scaffold the API and Controller for users to modify, as well as scaffold integration tests, RBAC rules, Dockerfiles, Makefiles, etc.
After adding their implementation to the project, users create the artifacts to publish their API through:

  1. Build and push the container image from the provided Dockerfile using make docker-build and make docker-push commands
  2. Deploy the API using make deploy command

Whether you are already a Controller aficionado or just want to learn what the buzz is about, check out the kubebuilder repo or take a look at an example in the kubebuilder book to learn about how simple and easy it is to build Controllers.

Get Involved

Kubebuilder is a project under SIG API Machinery and is being actively developed by contributors from many companies such as Google, Red Hat, VMware, Huawei and others. Get involved by giving us feedback through these channels:

Source