Running our own ELK stack with Docker and Rancher


A Detailed Overview of Rancher’s Architecture

This newly-updated, in-depth guidebook provides a detailed overview of the features and functionality of the new Rancher: an open-source enterprise Kubernetes platform.

Get the eBook

kibana2At
Rancher Labs we generate a lot of logs in our internal environments. As
we conduct more and more testing on these environments we have found the
need to centrally aggregate the logs from each environment. We decided
to use Rancherto build and run a scalable
ELK stack to manage all of these logs. For those that are unfamiliar
with the ELK stack, it is made up of Elasticsearch, Logstash and Kibana.
Logstash provides a pipeline for shipping logs from various sources and
input types, combining, massaging and moving them into Elasticsearch, or
several other stores. It is a really powerful tool in the logging
arsenal. Elasticsearch is a document database that is really good at
search. It can take our processed output from Logstash, analyze and
provides an interface to query all of our logging data. Together with
Kibana, a powerful visualization tool that consumes Elasticsearch data,
you have amazing ability to gain insights from your logging. Previously,
we have been using Elastic’s Found product and have been very impressed.
One of the interesting things we realized while using Found for
Elasticsearch is that the ELK stack really is made up of discrete parts.
Each part of the stack has its own needs and considerations. Found
provided us Elasticsearch and Kibana. There was no Logstash end point
provided, though it was sufficiently documented how to use Found with
Logstash. So, we have always had to run our own Logstash pipeline.
Logstash Our Logstash implementation includes three tiers, one each
for collection, queueing and processing. Collection- responsible for
providing remote endpoints for logging inputs. Like Syslog, Gelf,
Logstash. Once it receives these logs it places them quickly onto a
Redis Queue. Queuing tier – provided by Redis, a very fast in memory
database. It acts as a buffer between the collection and processing
tier. Processing tier – removes messages from the queue, and applies
filter plugins to the logs that manipulate the data to a desired format.
This tier does the heavy lifting and is often a bottleneck in a log
pipeline. Once it processes the data it forwards it along to the final
destination, which is Elasticsearch. Logstash
Pipeline
Each Logstash container has a configuration sidekick that provides
configuration through a shared volume.
By breaking the stack into these
tiers, you can scale and adapt each part without major impact to the
other parts of the stack. As a user, you can also scale and adjust each
tier to suit your needs. A good read on how to scale Logstash can be
found on Elastic’s web page here: Deploying and Scaling
Logstash
.
To build the Logstash stack we stared as we usually do. In general, we
try to reuse as much as possible from the community. Looking at the
DockerHub registry, we found there is already an official Logstash image
maintained by Docker. The real magic is in configuration of Logstash at
each of the tiers. To achieve maximum flexibility with configuration, we
built a confd container that consumes KV, or Key Value, data for its
configuration values. The logstash configurations are the most volatile,
and unique to an organization as they provide the interfaces for the
collection, indexing, and shipping of the logs. Each organization is
going to have different processing needs, formatting, tagging etc. To
achieve maximum flexibility we leveraged the confd tool and Rancher
sidekick containers. The sidekick creates an atomic scheduling unit
within Rancher. In this case, our configuration container exposes the
configuration files to our Logstash container through volume sharing. In
doing this, there is no modification needed to the default Docker
Logstash image. How is that for reuse! Elasticsearch Elasticsearch
is built out in three tiers as well. When reading the production
deployment recommendations, it discusses having nodes that are dedicated
masters, data nodes and client nodes. We followed the same deployment
paradigm with this application as the logstash implementation. We deploy
each role as a service. Each service is composed of an official image
and paired with a Confd sidekick container to provide configuration. It
ends up looking like this: Elastic Search
Tier
Each tier in the Elasticsearch stack has a confd container providing
configurations through a shared volume. These containers are scheduled
together inside of Rancher.
In the current configuration, we use the
master service to provide node discovery. When using the Rancher private
network, we disable multicast and enable unicast. Since every node in
the cluster points to the master they can talk to one another. The
Rancher network also allows the nodes to talk to one another. As a part
of our stack, we also use the Kopf tool to quickly visualize our
clusters health and perform other maintenance tasks. Once you bring up
the stack you will see that you can use Kopf to see that all the nodes
came up in the cluster. Kibana 4 Finally, in order to view all of
these logs and make sense of the data, we bring up Kibana to complete
our ELK stack. We have chosen to go with Kibana 4 in this stack. Kibana
4 is launched with an Nginx container to provide basic auth behind a
Rancher load balancer. The Kibana 4 instance is the Official image which
is hosted on DockerHub. The Kibana 4 image talks to the Elasticsearch
client nodes. So now we have a full ELK stack for taking logs and
shipping them to Elasticsearch for visualization in Kibana. The next
step is getting the logs from the hosts running your application.
Bringing up the Stack on Rancher So now you have the backstory on
how we came up with our ELK stack configuration. Here are instructions
to run the ELK stack on Rancher. This assumes that you already have a
Rancher environment running with at least one compute node. We will also
be using the Rancher compose CLI tool. Rancher-compose can be found on
GitHub here
rancher/rancher-compose.
You will need API keys from your Rancher deployment. In the instructions
below, we will bring up each component of the ELK stack, as its own
stack in Rancher. A stack in Rancher is a collection of services that
make up an application, and are defined by a Docker Compose file. In
this example, we will build the stacks in the same environment and use
cross stack linking to connect services. Cross stack linking allows
services in different stacks to discover each other through a DNS name.

  1. Clone our compose template repository: git clone
    https://github.com/rancher/compose-templates.git
  2. First lets bring up the Elasticsearch cluster.
    a. cd compose-templates/elasticsearch
    b. rancher-compose -p es up (Other services assume es as the
    elasticsearch stack name) This will bring up four services.
    – elasticsearch-masters
    – elasticsearch-datanodes
    – elasticsearch-clients
    – kopf
    c. Once Kopf is up, click on the container in the Rancher UI, and
    get the IP of the node it is running on.
    d. Open a new tab in your browser and go to the IP. You should see
    one datanode on the page.
  3. Now lets bring up our Logstash tier.
    a. cd ../logstash
    b. rancher-compose -p logstash up
    c. This will bring up the following services
    – Redis
    – logstash-collector
    – logstash-indexer
    d. At this point, you can point your applications at
    logtstash://host:5000.
  4. (Optional) Install logspout on your nodes
    a. cd ../logspout
    b. rancher-compose -p logspout up
    c. This will bring up a logspout container on every node in your
    Rancher environment. Logs will start moving through the pipeline
    into Elasticsearch.
  5. Finally, lets bring up Kibana 4
    a. cd ../kibana
    b. rancher-compose -p kibana up
    c. This will bring up the following services
    – kibana-vip
    – nginx-proxy
    – kibana4
    d. Click the container in the kibana-vip service in the Rancher UI.
    Visit the host ip in a separate browser tab. You will be
    directed to the Kibana 4 landing page to select your index.

Now that you have a fully functioning ELK stack on Rancher, you can
start sending your logs through the Logstash collector. By default the
collector is listening for Logstash inputs on UDP port 5000. If you are
running applications outside of Rancher, you can simply point them to
your Logstash endpoint. If your application runs on Rancher you can use
the optional Logspout-logstash service above. If your services run
outside of Rancher, you can configure your Logstash to use Gelf, and use
the Docker log driver. Alternatively, you could setup a Syslog listener,
or any number of supported Logstash input plugins. Conclusion
Running the ELK stack on Rancher in this way provides a lot of
flexibility to build and scale to meet any organization’s needs. It
also creates a simple way to introduce Rancher into your environment
piece by piece. As an operations team, you could quickly spin up
pipelines from existing applications to existing Elasticsearch clusters.
Using Rancher you can deploy applications following container best
practices by using sidekick containers to customize standard containers.
By scheduling these containers as a single unit, you can separate your
application out into separate concerns. On Wednesday, September 16th,
we hosted an online meetup focused on container logging, where I
demonstrated how to build and deploy your own ELK stack. If you’d like
to view a recording of this you can view it
here.
If you’d like to learn more about using Rancher, please join us for an
upcoming online meetup, or join our beta
program
or request a discussion with one
of our engineers.

Source

Adding Linux Dash As A System Service

Ivan Mikushin discussed adding system services to RancherOS using Docker Compose. Today I want to show you an exmaple of how to deploy Linux Dash as a system service. Linux Dash is a simple, low overhead, and web supported monitoring tool for Linux, you can read more about Linux Dash here. In this post i will add Linux Dash as a system service to RancherOS version 0.3.0 which allows users to add system services using rancherctl command. The Ubuntu’s console is the only service that is currently available in RancherOS.

Creating Linux Dash Docker Image

I build a 32MB node.js busybox image on top of the hwestphal/nodebox image, with linux-dash installed which will run on port 80 by default. The Docker file of this image:

FROM hwestphal/nodebox
MAINTAINER Hussein Galal

RUN opkg-install unzip
RUN curl -k -L -o master.zip https://github.com/afaqurk/linux-dash/archive/master.zip
RUN unzip master.zip
WORKDIR linux-dash-master
RUN npm install

ENTRYPOINT ["node","server"]

The image needs to be available on Docker Hub to be pulled later by RancherOS, so we should build and push the image:

# docker build -t husseingalal/busydash busydash/
# docker push husseingalal/busydash

Starting Linux Dash As A System Service

Linux Dash can be started as system service in RancherOS using rancherctl service enable <system-service> while <system-service> is the location of the yaml file that contains the option for starting the system service in RancherOS. linux-dash.yml

dash:
image: husseingalal/busydash
privileged: true
links:
- network
labels:
- io.rancher.os.scope=system
restart: always
pid: host
ipc: host
net: host

To start the previous configuration as a system service, run the following command on RancherOS:

~# rancherctl service enable /home/rancher/linux-dash/linux-dash.yml

By using this command, the service will also be added to the rancher.yml file and set to enabled, but a reboot needs to occur in order for it take effect. After rebooting, you can see that the dash service has been started using rancherctl command:

rancher@xxx:~$ sudo rancherctl service list
enabled  ubuntu-console
enabled  /home/rancher/linux-dash/linux-dash.yml

And you can see that the Dash container has been started as a system Docker container:

rancher@xxx:~$ sudo system-docker ps
CONTAINER ID        IMAGE                          COMMAND                CREATED             STATUS              PORTS               NAMES

447ada85ca78        rancher/ubuntuconsole:v0.3.0   "/usr/sbin/entry.sh    About an hour ago   Up About an hour                        console

fb7ce6f074e6        husseingalal/busydash:latest   "node server"          About an hour ago   Up About an hour                        dash

b7b1c734776b        userdocker:latest              "/usr/sbin/entry.sh    About an hour ago   Up About an hour                        userdocker

2990a5db9042        udev:latest                    "/usr/sbin/entry.sh    About an hour ago   Up About an hour                        udev

935486c2bf83        syslog:latest                  "/usr/sbin/entry.sh    About an hour ago   Up About an hour                        syslog

And to test the Web UI just enter the following url to your browser: http://server’s-ip 1617

Conclusion

In version 0.3.0 of RancherOS, you have the ability to create and manage your own RancherOS system services. System service in RancherOS make it easy to enable is a Docker container that will start at the OS startup and can be designed in Docker compose format. For more information about system services in RancherOS. You can find instructions on how to download RancherOS from Github.

Source

Using Compose to go from Docker to Kubernetes

Feb 6, 2019

For anyone using containers, Docker is a wonderful development platform, and Kubernetes is an equally wonderful production platform. But how do we go from one to the other? Specifically, if we use Compose to describe our development environment, how do we transform our Compose files into Kubernetes resources?

This is a translation of an article initially published in French. So feel free to read the French version if you prefer!

Before we dive in, I’d like to offer a bit of advertising space to the primary sponsor of this blog, i.e. myself: ☺

In February, I will deliver container training in Canada! There will be getting started with containers and getting started with orchestration with Kubernetes. Both sessions will be offered in Montréal in English, and in Québec in French. If you know someone who might be interested … I’d love if you could let them know! Thanks ♥

What are we trying to solve?

When getting started with containers, I usually suggest following this plan:

  • write a Dockerfile for one service, i.e. one component of your application, so that this service can run in a container;
  • run the other services of that app in containers as well, by writing more Dockerfiles or using pre-built images;
  • write a Compose file for the entire app;
  • … stop.

When you reach this stage, you’re already leveraging containers and benefiting from the work you’ve done so far, because at this point, anyone (with Docker installed on their machine) can build and run the app with just three commands:

Then, we can add a bunch of extra stuff: continuous integration (CI), continuous deployment (CD) to pre-production …

And then, one day, we want to go to production with these containers. And, within many organizations, “production with containers” means Kubernetes. Sure, we could debate about the respective merits of Mesos, Nomad, Swarm, etc., but here, I want to pretend that we chose Kubernetes (or that someone chose it for us), for better or for worse.

So here we are! How do we get from our Compose files to Kubernetes resources?

At first, it looks like this should be easy: Compose is using YAML files, and so is Kubernetes.

I see lots of YAML

Original image by Jake Likes Onions, remixed by @bibryam.

There is just one thing: the YAML files used by Compose and the ones used by Kubernetes have nothing in common (except being both YAML). Even worse: some concepts have totally different meanings! For instance, when using Docker Compose, a service is a set of identical containers (sometimes placed behind a load balancer), whereas with Kubernetes, a service is a way to access a bunch of resources (for instance, containers) that don’t have a stable network address. When there are multiple resources behind a single service, that service then acts as a load balancer. Yes, these different definitions are confusing; yes, I wish the authors of Compose and Kubernetes had been able to agree on a common lingo; but meanwhile, we have to deal with it.

Since we can’t wave a magic wand to translate our YAML files, what should we do?

I’m going to describe three methods, each with its own pros and cons.

100% Docker

If we’re using a recent version of Docker Desktop (Docker Windows or Docker Mac), we can deploy a Compose file on Kubernetes with the following method:

  1. In Docker Desktop’s preferences panel, select “Kubernetes” as our orchestrator. (If it was set to “Swarm” before, this might take a minute or two so that the Kubernetes components can start.)
  2. Deploy our app with the following command:

That’s all, folks!

In simple scenarios, this will work out of the box: Docker translates the Compose file into Kubernetes resources (Deployment, Service, etc.) and we won’t have to maintain extra files.

But there is a catch: this will run the app on the Kubernetes cluster running within Docker Destkop on our machine. How can we change that, so that the app runs on a production Kubernetes cluster?

If we’re using Docker Enterprise Edition, there is an easy solution: UCP (Universal Control Plane) can do the same thing, but while targeting a Docker EE cluster. As a reminder, Docker EE can run on the same cluster, side-by-side, applications managed by Kubernetes, and applications managed by Swarm. When we deploy an app by providing a Compose file, we pick which orchestrator we want to use, and that’s it.

(The UCP documentation explains this more in depth. We can also read this article on the Docker blog.)

This method is fantastic if we’re already using Docker Enterprise Edition (or plan to), because in addition to being the simplest option, it’s also the most robust, since we’ll benefit from Docker Inc’s support if needed.

Alright, but for the rest of us who do not use Docker EE, what do?

Use some tools

There are a few tools out there to translate a Compose file into Kubernetes resources. Let’s spend some time on Kompose, because it’s (in my humble opinion) the most complete at the moment, and the one with the best documentation.

We can use Kompose in two different ways: by working directly with our Compose files, or by translating them into Kubernetes YAML files. In the latter case, we deploy these files with kubectl, the Kubernetes CLI. (Technically, we don’t have to use the CLI; we could use these YAML files with other tools like WeaveWorks Flux or Gitkube, but let’s keep this simple!)

If we opt to work directly with our Compose files, all we have to do is use komposeinstead of docker-compose for most commands. In practice, we’ll start our app with kompose up (instead of docker-compose up), for instance.

This method is particularly suitable if we’re working with a large number of apps, for which we already have a bunch of Compose files, and we don’t want to maintain a second set of files. It’s also suitable if our Compose files evolve quickly, and we want to maintain parity between our Compose files and our Kubernetes files.

However, sometimes, the translation produced by Kompose will be imperfect, or even outright broken. For instance, if we are using local volumes (docker run -v /path/to/data:/data ...), we need to find another way to bring these files into our containers once they run on Kubernetes. (By using Persistent Volumes, for instance.) Sometimes, we might want to adapt the application architecture: for instance, to ensure that the web server and the app server are running together, within the same pod, instead of being two distinct entities.

In that case, we can use kompose convert, which will generate the YAML files corresponding to the resources that would have been created with kompose up. Then, we can edit these files and touch them up at will before loading them into our cluster.

This method gives us a lot of flexibility (since we can edit and transform the YAML files as much as necessary before using them), but this means any change or edit might have to be done again when we update the original Compose file.

If we maintain many applications, but with similar architectures (perhaps they use the same languages, frameworks, and patterns), then we can use kompose convert, followed by an automated post-processing step on the generated YAML files. However, if we maintain a small number of apps (and/or they are very different from each other), writing custom post-processing scripts suited to every scenario may be a lot of work. And even then, it’s a good idea to double-check the output of these scripts a number of times, before letting them output YAML that would go straight to production. This might warrant even more work; more than you might want to invest.

Is it worth the time to automate?

This table (courtesy of XKCD) tells us how much time we can spend on automation before it gets less efficient than doing things by hand.

I’m a huge fan of automation. Automation is great. But before I automate something, I need to be able to do it …

… Manually

The best way to understand how these tools work, is to do their job ourselves, by hand.

Just to make it clear: I’m not suggesting that you do this on all your apps (especially if you have many apps!), but I would like to show my own technique for converting a Compose app into Kubernetes resources.

The basic idea is simple: each line in our Compose file must be mapped to something in Kubernetes. If I were to print the YAML for both my Compose file and my Kubernetes resources, and put them side by side, for each line in the Compose file, I should be able to draw an arrow pointing to a line (or multiple lines) on the Kubernetes side.

This helps me to make sure that I haven’t skipped anything.

Now, I need to know how to express every section, parameter, and option in the Compose file. Let’s see how it works on a small example!

This is an actual Compose file written (and used) by one of my customers. I replaced image and host names to respect their privacy, but other than that, it’s verbatim. This Compose file is used to run a LAMP stack in a preproduction environment on a single server. The next step is to “Kubernetize” this app (so that it can scale horizontally if necessary).

Next to each line of the Compose file, I indicated how I translated it into a Kubernetes resource. In another post (to be published next week), I will explain step by step the details of this translation from Compose to Kubernetes.

This is a lot of work. Furthermore, that work is specific to this app, and has to be re-done for every other app! This doesn’t sound like an efficient technique, does it? In this specific case, my customer has a whole bunch of apps that are very similar to the first one that we converted together. Our goal is to build an app template (for instance, by writing a Helm Chart) that we can reuse, or at least use as a base, for many applications.

If the apps differ significantly, there’s no way around it: we need to convert them one by one.

In that case, my technique is to tackle the problem by both ends. In concrete terms, that means converting an app manually, and then thinking about what we can adapt and tweak so that the original app (running under Compose) can be easier to deploy with Kubernetes. Some tiny changes can help a lot. For instance, if we connect through another service through a FQDN (e.g. sql-57.whatever.com), replace it with a short name (e.g. sql) and use a Service (with an ExternalName or static endpoints). Or use an environment variable to switch the code behavior. If we normalize our applications, it is very likely that we will be able to deal with them automatically with Kompose or Docker Enterprise Edition.

(This, by the way, is the whole point of platforms like OpenShift or CloudFoundry: they restrict what you can do to a smaller set of options, making that set of options easier to manage from an automation standpoint. But I digress!)

Conclusions

Moving an app from Compose to Kubernetes requires transforming the application’s Compose file into multiple Kubernetes resources. There are tools (like Kompose) to do this automatically, but these tools are no silver bullet (at least, not yet).

And even if we use a tool, we need to understand how it works and what it’s producing. We need to be familiar with Kubernetes, its concepts, and various resource types.

This is the perfect opportunity to bring up the training sessions that we’re organizing in February 2019 in Canada!

There will be:

These sessions are designed to complement each other, so you can follow both of them if you want to ramp up your skills in containers and orchestration.

If you wonder what these training sessions look like, our slides and other materials are publicly available on http://container.training/. You will also find a few videos taken during previous sessions and workshops. This will help you to figure out if this content is what you need!

Source

Poseidon-Firmament Scheduler – Flow Network Graph Based Scheduler

Wednesday, February 06, 2019

Poseidon-Firmament Scheduler – Flow Network Graph Based Scheduler

Authors: Deepak Vij (Huawei), Shivram Shrivastava (Huawei)

Introduction

Cluster Management systems such as Mesos, Google Borg, Kubernetes etc. in a cloud scale datacenter environment (also termed as Datacenter-as-a-Computer or Warehouse-Scale Computing – WSC) typically manage application workloads by performing tasks such as tracking machine live-ness, starting, monitoring, terminating workloads and more importantly using a Cluster Scheduler to decide on workload placements.

Cluster Scheduler essentially performs the scheduling of workloads to compute resources – combining the global placement of work across the WSC environment makes the “warehouse-scale computer” more efficient, increases utilization, and saves energy. Cluster Scheduler examples are Google Borg, Kubernetes, Firmament, Mesos, Tarcil, Quasar, Quincy, Swarm, YARN, Nomad, Sparrow, Apollo etc.

In this blog post, we briefly describe the novel Firmament flow network graph based scheduling approach (OSDI paper) in Kubernetes. We specifically describe the Firmament Scheduler and how it integrates with the Kubernetes cluster manager using Poseidon as the integration glue. We have seen extremely impressive scheduling throughput performance benchmarking numbers with this novel scheduling approach. Originally, Firmament Scheduler was conceptualized, designed and implemented by University of Cambridge researchers, Malte Schwarzkopf & Ionel Gog.

Poseidon-Firmament Scheduler – How It Works

At a very high level, Poseidon-Firmament scheduler augments the current Kubernetes scheduling capabilities by incorporating novel flow network graph based scheduling capabilities alongside the default Kubernetes Scheduler. It models the scheduling problem as a constraint-based optimization over a flow network graph – by reducing scheduling to a min-cost max-flow optimization problem. Due to the inherent rescheduling capabilities, the new scheduler enables a globally optimal scheduling environment that constantly keeps refining the workloads placements dynamically.

Key Advantages

Flow graph scheduling based Poseidon-Firmament scheduler provides the following key advantages:

  • Workloads (pods) are bulk scheduled to enable scheduling decisions at massive scale.
  • Based on the extensive performance test results, Poseidon-Firmament scales much better than Kubernetes default scheduler as the number of nodes increase in a cluster. This is due to the fact that Poseidon-Firmament is able to amortize more and more work across workloads.
  • Poseidon-Firmament Scheduler outperforms the Kubernetes default scheduler by a wide margin when it comes to throughput performance numbers for scenarios where compute resource requirements are somewhat uniform across jobs (Replicasets/Deployments/Jobs). Poseidon-Firmament scheduler end-to-end throughput performance numbers, including bind time, consistently get better as the number of nodes in a cluster increase. For example, for a 2,700 node cluster (shown in the graphs here), Poseidon-Firmament scheduler achieves a 7X or greater end-to-end throughput than the Kubernetes default scheduler, which includes bind time.
  • Availability of complex rule constraints.
  • Scheduling in Poseidon-Firmament is very dynamic; it keeps cluster resources in a global optimal state during every scheduling run.
  • Highly efficient resource utilizations.

Firmament Flow Network Graph – An Overview

Firmament scheduler runs a min-cost flow algorithm over the flow network to find an optimal flow, from which it extracts the implied workload (pod placements). A flow network is a directed graph whose arcs carry flow from source nodes (i.e. pod nodes) to a sink node. A cost and capacity associated with each arc constrain the flow, and specify preferential routes for it.

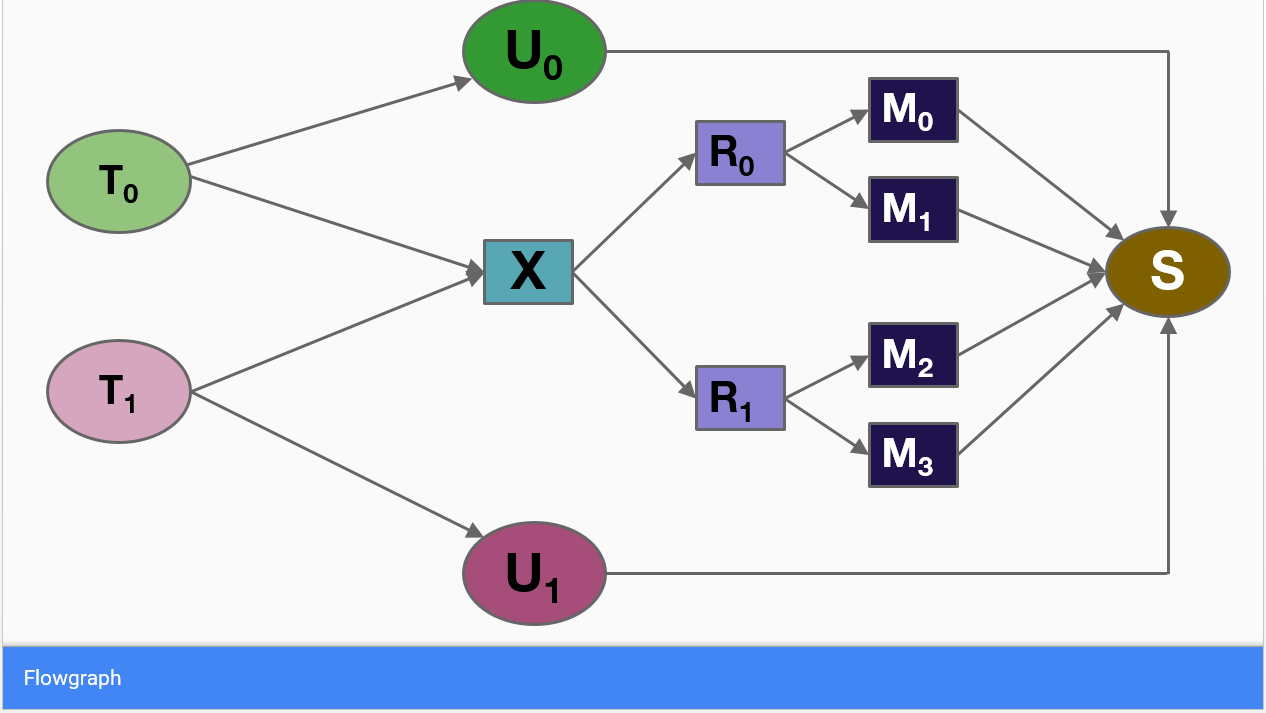
Figure 1 below shows an example of a flow network for a cluster with two tasks (workloads or pods) and four machines (nodes) – each workload on the left hand side, is a source of one unit of flow. All such flow must be drained into the sink node (S) for a feasible solution to the optimization problem.

Figure 1. Example of a Flow Network

Poseidon Mediation Layer – An Overview

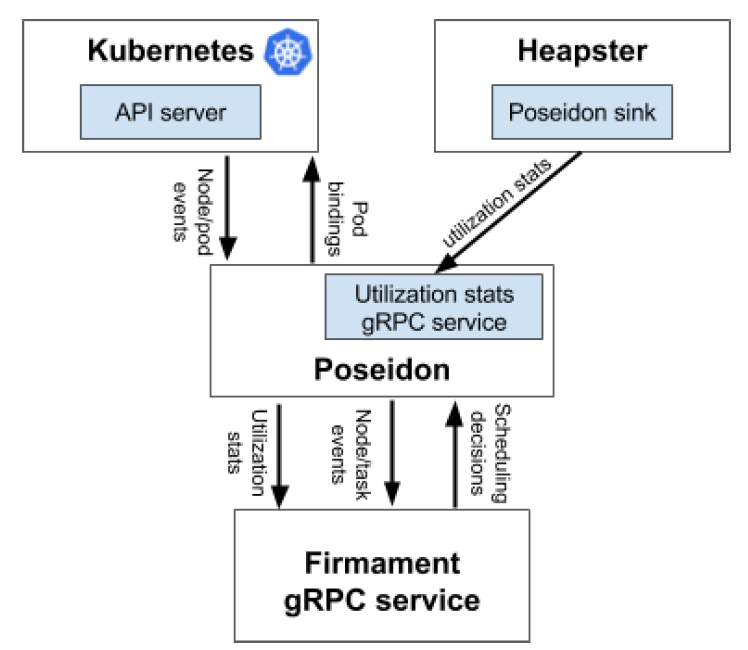
Poseidon is a service that acts as the integration glue for the Firmament scheduler with Kubernetes. It augments the current Kubernetes scheduling capabilities by incorporating new flow network graph based Firmament scheduling capabilities alongside the default Kubernetes Scheduler; multiple schedulers running simultaneously. Figure 2 below describes the high level overall design as far as how Poseidon integration glue works in conjunction with the underlying Firmament flow network graph based scheduler.

Figure 2. Firmament Kubernetes Integration Overview

As part of the Kubernetes multiple schedulers support, each new pod is typically scheduled by the default scheduler, but Kubernetes can be instructed to use another scheduler by specifying the name of another custom scheduler (in our case, Poseidon-Firmament) at the time of pod deployment. In this case, the default scheduler will ignore that Pod and allow Poseidon scheduler to schedule the Pod to a relevant node.

Note: For details about the design of this project see the design document.

Possible Use Case Scenarios – When To Use It

Poseidon-Firmament scheduler enables extremely high throughput scheduling environment at scale due to its bulk scheduling approach superiority versus K8s pod-at-a-time approach. In our extensive tests, we have observed substantial throughput benefits as long as resource requirements (CPU/Memory) for incoming Pods is uniform across jobs (Replicasets/Deployments/Jobs), mainly due to efficient amortization of work across jobs.

Although, Poseidon-Firmament scheduler is capable of scheduling various types of workloads (service, batch, etc.), following are the few use cases where it excels the most:

  1. For “Big Data/AI” jobs consisting of a large number of tasks, throughput benefits are tremendous.
  2. Substantial throughput benefits also for service or batch job scenarios where workload resource requirements are uniform across jobs (Replicasets/Deplyments/Jobs).

Current Project Stage

Currently Poseidon-Firmament project is an incubation project. Alpha Release is available at https://github.com/kubernetes-sigs/poseidon.

Source

Ansible Docker | Application Automation

[Ansible-Docker-RancherOver the last year I’ve been using Rancher with Ansible, and have found that using the two together can be incredibly useful. If you aren’t familiar with Ansible, it is a powerful configuration management tool which can be used to manage servers remotely without a daemon or agent running on the host. Instead, it uses SSH to connect with hosts, and applies tasks directly on the machines. Because of this, as long as you have SSH access to the host, (and Python) running on the host, you will be able to use Ansible to manage hosts remotely. You can find detailed ][documentation][ for Ansible on the company’s website..] [In this post, I will be using Ansible with Docker to automate the build out of a simple wordpress environment on a ]Rancher[ deployment. Specifically, I will include the following steps:]

  • [Installing Docker on my hosts using Ansible.]
  • [Setting up a fresh Rancher installation using Ansible.]
  • [Registering hosts with Rancher using Ansible.]
  • [Deploying the Application containers on the Hosts.]

Preparing the Playbook

[Ansible uses “playbooks’ which are Ansible’s configuration and orchestration language, These playbooks are expressed in YAML format, and describes set of tasks that will run on remote hosts, see this ][introduction][ for more information on how to use Ansible playbooks] [in our case the ][playbook][ will run on 3 servers, one server for the ]Rancher[ platform, the second server for the ]MySQL[ database, and the last one for the ]WordPress[ application.] [The addresses and information about the previous servers are listed in the following Ansible inventory file, the inventory is the file that contains names, addresses, and ports of the remote hosts where the Ansible playbook is going to execute:] inventory file:

[Rancher]
rancher ansible_ssh_port=22 ansible_ssh_host=x.x.x.x

[nodes:children]
application
database

[application]
node1 ansible_ssh_port=22 ansible_ssh_host=y.y.y.y

[database]
node2 ansible_ssh_port=22 ansible_ssh_host=z.z.z.z

[Note that I used grouping in the inventory to better describe the list of machines used in this deployment, ][The playbook itself will consists of five ]plays[, which will result in deploying the WordPress application:]

  • Play #1[ Installing and configuring Docker ]

[The first play will install and configure ]Docker[ on all machines, it uses the “docker” role which we will see in the next section.]

  • Play #2[ Setting up Rancher server]

[This play will install Rancher server and make sure it is up and running, this play will only run on one server which is considered to be the Rancher server.]

  • Play #3[ Registering Rancher hosts]

[This play will run on two machines to register each of them with the Rancher server which should be up and running from the last play.]

  • Play #4[ Deploy MySQL Container]

[This is a simple play to deploy the MySQL container on the database server.]

  • play #5[ Deploy WordPress App]

[This play will install the WordPress application on the second machine and link it to the MySQL container.] rancher.yml (the playbook file)

---
# play 1
- name: Installing and configuring Docker
  hosts: all
  sudo: yes
  roles:
    - { role: docker, tags: ["docker"] }

# play 2
- name: Setting up Rancher Server
  hosts: "rancher"
  sudo: yes
  roles:
    - { role: rancher, tags: ["rancher"] }

# play 3
- name: Register Rancher Hosts
  hosts: "nodes"
  sudo: yes
  roles:
    - { role: rancher_reg, tags: ["rancher_reg"] }

# play 4
- name: Deploy MySQL Container
  hosts: 'database'
  sudo: yes
  roles:
      - { role: mysql_docker, tags: ["mysql_docker"] }

# play 5
- name: Deploy WordPress App
  hosts: "application"
  sudo: yes
  roles:
    - { role: wordpress_docker, tags: ["wordpress_docker"] }

Docker role

[This role will install the latest version of Docker on all the servers, the role assumes that you will use Ubuntu 14.04, because some other Ubuntu distros require some dependencies to run docker which is not discussed here, see the Docker ][documentation][ for more information on installing Docker on different platforms.]

- name: Fail if OS distro is not Ubuntu 14.04
  fail:
      msg="The role is designed only for Ubuntu 14.04"
  when: "{{ ansible_distribution_version | version_compare('14.04', '!=') }}"

[The Docker module in Ansible requires ]docker-py[ library to be installed on the remote server, so at first we use python-pip to install docker-py library on all servers before installing the Docker:]

- name: Install dependencies
  apt:
      name={{ item }}
      update_cache=yes
  with_items:
      - python-dev
      - python-setuptools

- name: Install pip
  easy_install:
      name=pip

- name: Install docker-py
  pip:
      name=docker-py
      state=present
      version=1.1.0

The next tasks will import the Docker apt repo and install Docker:

- name: Add docker apt repo
  apt_repository:
      repo='deb https://apt.dockerproject.org/repo ubuntu-{{ ansible_distribution_release }} main'
      state=present

- name: Import the Docker repository key
  apt_key:
      url=https://apt.dockerproject.org/gpg
      state=present
      id=2C52609D

- name: Install Docker package
  apt:
      name=docker-engine
      update_cache=yes

Finally the next three tasks will create a system group for Docker and add any user defined in “docker_users” variable to this group, and it will copy template for Docker configuration then restart Docker.

- name: Create a docker group
  group:
      name=docker
      state=present

- name: Add user(s) to docker group
  user:
      name={{ item }}
      group=docker
      state=present
  with_items: docker_users
  when: docker_users is defined

- name: Configure Docker
  template:
      src=default_docker.j2
      dest=/etc/default/docker
      mode=0644
      owner=root
      group=root
  notify: restart docker

The “default_docker.j2” template will check for the variable “docker_opts” which is not defined by default, and if it is defined will add the options defined in the variable to the file:

# Docker Upstart and SysVinit configuration file

# Use DOCKER_OPTS to modify the daemon startup options.
{% if docker_opts is defined %}
DOCKER_OPTS="{{ docker_opts | join(' ')}}"
{% endif %}

Rancher role

[The rancher role is really simple, its goal is to pull and run the Rancher’s Docker image from the hub, and then wait for the Rancher server to start and listen for incoming connections:]

---
- name: Pull and run the Rancher/server container
  docker:
      name: "{{ rancher_name }}"
      image: rancher/server
      restart_policy: always
      ports:
        - "{{ rancher_port }}:8080"

- name: Wait for the Rancher server to start
  action: command docker logs {{ rancher_name }}
  register: rancher_logs
  until: rancher_logs.stdout.find("Listening on") != -1
  retries: 30
  delay: 10

- name: Print Rancher's URL
  debug: msg="You can connect to rancher server http://{{ ansible_default_ipv4.address }}:{{ rancher_port }}"

Rancher Registration Role

The rancher_reg role will pull and run the rancher_agent Docker image, first it will use Rancher’s API to return the registration token to run each agent with the right registration url, this token is needed to register hosts in Rancher environment:

---
- name: Install httplib2
  apt:
      name=python-httplib2
      update_cache=yes

- name: Get the default project id
   action: uri
       method=GET
       status_code=200
       url="http://{{ rancher_server }}:{{ rancher_port }}/v1/projects" return_content=yes
   register: project_id

- name: Return the registration token URL of Rancher server
  action: uri
      method=POST
      status_code=201
      url="http://{{ rancher_server }}:{{ rancher_port }}/v1/registrationtokens?projectId={{ project_id.json['data'][0]['id'] }}" return_content=yes
  register: rancher_token_url

- name: Return the registration URL of Rancher server
  action: uri
      method=GET
      url={{ rancher_token_url.json['links']['self'] }} return_content=yes
  register: rancher_token

Then it will make sure that no other agent is running on the server and it will run the Rancher Agent:

- name: Check if the rancher-agent is running
  command: docker ps -a
  register: containers

- name: Register the Host machine with the Rancher server
  docker:
      image: rancher/agent:v{{ rancher_agent_version }}
      privileged: yes
      detach: True
      volumes: /var/run/docker.sock:/var/run/docker.sock
      command: "{{ rancher_token.json['registrationUrl'] }}"
      state: started
  when: "{{ 'rancher-agent' not in containers.stdout }}"

MySQL and WordPress Roles

[The two roles are using Ansible ][Docker’s][ module to run Docker images on the server, you will note that each Docker container will start with ]RANCHER_NETWORK=true[ environment variable, which will cause the Docker container to use Rancher’s managed network so that containers can communicate on different hosts in the same private network.] [I will use the official ][MySQL][ and ][Wordpress][ images, the MySQL image requires the ]MYSQL_ROOT_PASSWORD[ environment variable to start, you can also start it with default database and user which will be granted superuser permissions on this database.]

- name: Create a mysql docker container
  docker:
      name: mysql
      image: mysql:{{ mysql_version }}
      detach: True
      env: RANCHER_NETWORK=true,
           MYSQL_ROOT_PASSWORD={{ mysql_root_password }}

- name: Wait a few minutes for the IPs to be set to the container
  wait_for: timeout=120

# The following tasks help with the connection of the containers in different hosts in Rancher
- name: Fetch the MySQL Container IP
  shell: docker exec mysql ip -o -4 addr list eth0 | awk '{print $4}' | cut -d/ -f1 |  sed -n 2p
  register: mysql_sec_ip

- name: print the mysql rancher's ip
  debug: msg={{ mysql_sec_ip.stdout }}

[Note that role will wait for 2 minutes until to make sure that the container is configured with the right IPs, and then it will fetch the container’s secondary ip which is the ip used in Rancher’s network and save it to the ]mysql_sec_ip[ variable which will survive through the playbook, WordPress image on other hand will start with ]WORDPRESS_DB_HOST[ set to the ip of the mysql container we just started.]

- name: Create a wordpress docker container
  docker:
      name: wordpress
      image: wordpress:{{ wordpress_version }}
      detach: True
      ports:
      - 80:80
      env: RANCHER_NETWORK=true,
         WORDPRESS_DB_HOST={{ mysql_host }}:3306,
         WORDPRESS_DB_PASSWORD={{ mysql_root_password }},
         WORDPRESS_AUTH_KEY={{ wordpress_auth_key }},
         WORDPRESS_SECURE_AUTH_KEY={{ wordpress_secure_auth_key }},
         WORDPRESS_LOGGED_IN_KEY={{ wordpress_logged_in_key }},
         WORDPRESS_NONCE_KEY={{ wordpress_nonce_key }},
         WORDPRESS_AUTH_SALT={{ wordpress_auth_salt }},
         WORDPRESS_SECURE_AUTH_SALT={{ wordpress_secure_auth_salt }},
         WORDPRESS_NONCE_SALT={{ wordpress_nonce_salt }},
         WORDPRESS_LOGGED_IN_SALT={{ wordpress_loggedin_salt }}

Managing Variables

Ansible defines variables in different layers, some of layers override the others, so for our case I added a default set of variables for each role to be used in different playbooks later, and added the currently used variables in the group_vars directory to override them.

├── group_vars
│   ├── all.yml
│   ├── nodes.yml
│   └── Rancher.yml
├── hosts
├── rancher.yml
├── README.md
└── roles
    ├── docker
    ├── mysql_docker
    ├── rancher
    ├── rancher_reg
    └── wordpress_docker

The nodes.yml variables will apply on the nodes group defined in the inventory file which contains the database and application servers, this file contains information used by mysql and wordpress containers:

---
rancher_server: "{{ hostvars['rancher']['ansible_ssh_host'] }}"

# MySQL variables
mysql_root_password: "{{ lookup('password', mysql_passwd_tmpfile + ' length=20 chars=ascii_letters,digits') }}"
mysql_passwd_tmpfile: /tmp/mysqlpasswd.file
mysql_host: "{{ hostvars.node2.mysql_sec_ip.stdout }}"
mysql_port: 3306
mysql_version: 5.5

# WordPress variables
wordpress_version: latest

[You may note that I used password lookup to generate a random password for mysql root password, a good alternative for this method would be ][vault][ to encrypt sensitive data like passwords or keys.]

Running the Playbook

[To run the playbook, I fired up 3 machines with Ubuntu 14.04 installed and added their IPs to the inventory we saw earlier, and then used the following command to start the playbook:]

$ ansible-playbook -u root -i hosts rancher.yml

[After the playbook finishes its work, you can access the Rancher server and you will see the following:] rancher\_nodes[And when accessing the IP of node1 on port 80 you will access WordPress:] wordpress\_rancher

Conclusion

[Ansible is a very powerful and simple automation tool that can be used to manage and configure a fleet of servers, using Ansible with Rancher can be a very efficient method to start your environment and manage your Docker containers. This month we are hosting an online meetup in which we’ll be demonstrating how to run microservices in Docker containers and orchestration application upgrades using Rancher. Please join us for this meetup to learn more. ]

Source

Deploying a scalable Jenkins cluster with Docker and Rancher

Containerization brings several benefits to traditional CI platforms where builds share hosts: build dependencies can be isolated, applications can be tested against multiple environments (testing a Java app against multiple versions of JVM), on-demand build environments can be created with minimal stickiness to ensure test fidelity, Docker Compose can be used to quickly bring up environments which mirror development environments. Lastly, the inherent isolation offered by Docker Compose-based stacks allow for concurrent builds — a sticking point for traditional build environments with shared components.

One of the immediate benefits of containerization for CI is that we can leverage tools such as Rancher to manage distributed build environments across multiple hosts. In this article, we’re going to launch a distributed Jenkins cluster with Rancher Compose. This work builds upon the earlier work** **by one of the authors, and further streamlines the process of spinning up and scaling a Jenkins stack.

Our Jenkins Stack

jenkins\_master\_slave For our stack, we’re using Docker in Docker (DIND) images for Jenkins master** and slave **running on top of Rancher compute nodes launched in Amazon EC2. With DIND, each Jenkins container runs a Docker daemon within itself. This allows us to create build pipelines for dockerized applications with Jenkins.

Prerequisites

  • [AWS EC2 account]
  • [IAM credentials for docker machine]
  • [Rancher Server v0.32.0+]
  • [Docker 1.7.1+]
  • [Rancher Compose]
  • [Docker Compose]

Setting up Rancher

Step 1: Setup an EC2 host for Rancher server

First thing first, we need an EC2 instance to run the Rancher server. We recommend going with Ubuntu 14.04 AMI for it’s up-to-date kernel. Make sure[ to configure the security group for the EC2 instance with access to port 22 (SSH) and 8080 (rancher web interface):]

launch\_ec2\_instance\_for\_rancher\_step\_2

[Once the instance starts, the first order of business is to ][install the latest version of Docker by following the steps below (for Ubuntu 14.04):]

  1. [sudo apt-get update]
  2. [curl -sSL https://get.docker.com/ | sh (requires sudo password)]
  3. [sudo usermod -aG docker ubuntu]
  4. [Log out and log back in to the instance]

At this point you should be able to run docker without sudo.

[Step 2: Run and configure Rancher]

[To install and run the latest version of Rancher (v0.32.0 at the time of writing), follow the instructions in the docs. In a few minutes your Rancher server should be up and ready to serve requests on port 8080. ][If you browse to http://YOUR_EC2_PUBLIC_IP:8080/ you will be greeted with a welcome page and a notice asking you to configure access. ][This is an important step to prevent unauthorized access to your Rancher server. Head over to the settings section and follow the instructions here to configure access control. ]

rancher\_setup\_step\_1

[We typically create a separate environment for hosting all developer facing tools, e.g., Jenkins, Seyren, Graphite etc to isolate them from the public facing live services. To this end, we’re going to create an environment called *Tools. *From the environments menu (top left), select \“manage environments\” and create a new environment. Since we’re going to be working in this environment exclusively, let’s go ahead and make this our default environment by selecting \“set as default login environment\” from the environments menu. ]

rancher\_setup\_step\_2\_add\_tools\_env

The next step is to tell Rancher about our hosts. For this tutorial, we’ll launch all hosts with Ubuntu 14.04. Alternatively, you can add an existing host using the custom host** **option in Rancher. Just make sure that your hosts are running Docker 1.7.1+.

rancher\_setup\_step\_3\_add\_ec2\_host

One of the hosts (JENKINS_MASTER_HOST) is going to run Jenkins master and would need some additional configuration. First, we need to open up access to port 8080 (default Jenkins port). You can do that by updating the security group used by that instance fom the AWS console. In our case, we updated the security group ( \“rancher-machine\” ) which was created by rancher. Second, we need to attach an additional EBS-backed volume to host Jenkins configuration. Make sure that you allocate enough space for the volume, based on how large your build workspaces tend to get. In addition, make sure the flag \“delete on termination\” is unchecked. That way, the volume can be re-attached to another instance and backed up easily:

[![launch\_ec2\_ebs\_volume\_for\_jenkins](http://cdn.rancher.com/wp-content/uploads/2015/08/01132712/launch_ec2_ebs_volume_for_jenkins.png)](http://cdn.rancher.com/wp-content/uploads/2015/08/01132712/launch_ec2_ebs_volume_for_jenkins.png)

Lastly, let’s add a couple of labels for the JENKINS_MASTER_HOST; 1) add a label called \“profile\” with the value as \“jenkins\” and 2) add a label called \“jenkins-master\” with the value \“true\“. We’re going to use these labels later to schedule master and slave containers on our hosts.

Step 3: Download and install rancher-compose CLI

As a last step, we need to install the rancher-compose CLI on our development machine. To do that, head over to the applications tab in Rancher and download the rancher compose CLI for your system. All you need is to add the path-to-your-rancher-compose-CLI to your *PATH *environment variable.

rancher\_setup\_step\_5\_install\_rancher\_compose

With that, our rancher server is ready and we can now launch and manage containers with it.

Launching Jenkins stack with Rancher

Step 1: Stack configuration

Before we launch the Jenkins stack, we need to create a new Rancher API key from API & Keys section under settings. Save the API key pair some place safe as we’re going to need it with rancher-compose. For the rest of the article, we refer to the API key pair as [RANCHR_API_KEY and RANCHER_API_KEY_SECRET]. Next, open up a terminal to fetch the latest version of Docker and Rancher Compose templates from Github:

git clone https://github.com/rancher/jenkins-rancher.git
cd jenkins-rancher

Before we can use these templates, let’s quickly update the configuration. First, open up the Docker Compose file and update the Jenkins username and password to a username and password of your choice. Let’s call these credentials JENKINS_USERand JENKINS_PASSWORD. These credentials will be used by the Jenkins slave to talk to master. Second, update the host tag for slave and master to match the tags you specified for your rancher compute hosts. Make sure that theio.rancher.scheduler.affinity:host_label has a value of \“profile=jenkins\” for jenkins-slave. Similarly, for jenkins-master, make sure that the value for io.rancher.scheduler.affinity:host_label is \“jenkins-master=true\“. This will ensure that rancher containers are only launched on the hosts that you want to limit them to. For example, we are limiting our Jenkins master to only run on a host with an attached EBS volume and access to port 8080.

jenkins-slave:
  environment:
    JENKINS_USERNAME: jenkins
    JENKINS_PASSWORD: jenkins
    JENKINS_MASTER: http://jenkins-master:8080
  labels:
    io.rancher.scheduler.affinity:host_label: profile=jenkins
  tty: true
  image: techtraits/jenkins-slave
  links:
  - jenkins-master:jenkins-master
  privileged: true
  volumes:
  - /var/jenkins
  stdin_open: true
jenkins-master:
  restart: 'no'
  labels:
    io.rancher.scheduler.affinity:host_label: jenkins-master=true
  tty: true
  image: techtraits/jenkins-master
  privileged: true
  stdin_open: true
  volume_driver: /var/jenkins_home
jenkins-lb:
  ports:
  - '8080'
  tty: true
  image: rancher/load-balancer-service
  links:
  - jenkins-master:jenkins-master
  stdin_open: true

Step 2: Create the Jenkins stack with Rancher compose

[Now we’re all set to launch the Jenkins stack. Open up a terminal, navigate to the \”jenkins-rancher\” directory and type: ]
rancher-compose --url http://RANCHER_HOST:RANCHER_PORT/v1/ --access-key RANCHER_API_KEY --secret-key RANCHER_API_KEY_SECRET --project-name jenkins --verbose create
[The output of the rancher compose command should look something like:]

[DEBU[0000] Opening compose file: docker-compose.yml][ DEBU[0000] Opening rancher-compose file: /home/mbsheikh/jenkins-rancher/rancher-compose.yml][ DEBU[0000] [0/3] [jenkins-slave]: Adding][ DEBU[0000] Found environment: jenkins(1e9)][ DEBU[0000] Launching action for jenkins-master][ DEBU[0000] Launching action for jenkins-slave][ DEBU[0000] Launching action for jenkins-lb][ DEBU[0000] Project [jenkins]: Creating project][ DEBU[0000] Finding service jenkins-master][ DEBU[0000] [0/3] [jenkins-master]: Creating][ DEBU[0000] Found service jenkins-master][ DEBU[0000] [0/3] [jenkins-master]: Created][ DEBU[0000] Finding service jenkins-slave][ DEBU[0000] Finding service jenkins-lb][ DEBU[0000] [0/3] [jenkins-slave]: Creating][ DEBU[0000] Found service jenkins-slave][ DEBU[0000] [0/3] [jenkins-slave]: Created][ DEBU[0000] Found service jenkins-lb][ DEBU[0000] [0/3] [jenkins-lb]: Created]

Next, verify that we have a new stack with three services:

rancher\_compose\_2\_jenkins\_stack\_created

Before we start the stack, let’s make sure that the services are properly linked. Go to your stack’s settings and select \“View Graph\” which should display the links between various services:

rancher\_compose\_3\_jenkins\_stack\_graph

Step 3: Start the Jenkins stack with Rancher compose

To start the stack and all of Jenkins services, we have a couple of options; 1) select \“Start Services\” option from Rancher UI, or 2) invoke rancher-compose CLI with the following command:

rancher-compose --url http://RANCHER_HOST:RANCHER_PORT/v1/ --access-key RANCHER_API_KEY --secret-key RANCHER_API_KEY_SECRET --project-name jenkins --verbose start

Once everything is running, find out the public IP of the host running \“jenkins-lb\” from the Rancher UI and browse to http://HOST_IP_OF_JENKINS_LB:8080/. If everything is configured correctly, you should see the Jenkins landing page. At this point, both your Jenkins master and slave(s) should be running; however, if you check the logs for your Jenkins slave, you would see 404 errors where the Jenkins slave is unable to connect to the Jenkins master. We need to configure Jenkins to allow for slave connections.

Configuring and Testing Jenkins

In this section, we’ll go through the steps needed to configure and secure our Jenkins stack. First, let’s create a Jenkins user with the same credentials (JENKINS_USER and JENKINS_PASSWORD) that you specified in your docker compose configuratio[n file. ]Next, to enable security for Jenkins, navigate to \“manage Jenkins\” and select \“enable security\” from the security configuration. Make sure to specify 5000 as a fixed port for \“TCP port for JNLP slave agents\“. Jenkins slaves communicate with the master node on this port.

setup\_jenkins\_1\_security

For the Jenkins slave to be able to connect to the master, we first need to install the Swarm plugin. The plugin can be installed from the \“manage plugins\” section in Jenkins. Once you have the swarm plugin installed, your Jenkins slave should show up in the \“Build Executor Status\” tab:

setup\_jenkins\_2\_slave\_shows\_up

Finally, to complete the master-slave configuration, head over to \“manage Jenkins\“. You should now see a notice about enabling master security subsystem. Go ahead and enable the subsystem; it can be used to control access between master and slaves:

setup\_jenkins\_3\_master\_slave\_security\_subsystem

Before moving on, let’s configure Jenkins to work with Git and Java based projects. To configure git, simply install the git plugin. Then, select \“Configure\” from \“Manage Jenkins\” settings and set up the JDK and maven installers you want to use for your projects:

[setup\_jenkins\_4\_jdk\_7]

setup\_jenkins\_5\_maven\_3

The steps above should be sufficient for building docker or maven based Java projects. To test our new Jenkins stack, let’s create a docker based job. Create a new \“Freestyle Project\” type job named \“docker-test\” and add the following build step and select \“execute shell\” with the following commands:

docker -v
docker run ubuntu /bin/echo hello world
docker stop $(docker ps -a -q)
docker rm $(docker ps -a -q)
docker rmi $(docker images -q)

Save the job and run. In the console output, you should see the version of docker running inside your Jenkins container and the output for other docker commands in our job.

Note: The stop, rm and rmi commands used in the above shell script stops and cleans up all containers and images. Each Jenkins job should only touch it’s own containers, and therefore, we recommend deleting this job after a successful test.

Scaling Jenkins with Rancher

This is an area where Rancher really shines; it makes managing and scaling Docker containers trivially easy. In this section we’ll show you how to scale up and scale down the number of Jenkins slaves based on your needs.

In our initial setup, we only had one EC2 host registered with Rancher and all three services (Jenkins load balancer, Jenkins master and Jenkins slave) running on the same host. It looks like:

rancher\_one\_host

We’re now going to register another host by following the instructions here:

rancher\_setup\_step\_4\_hosts

jenkins\_scale\_upTo launch more Jenkins slaves, simply click \“Scale up\” from your \“Jenkins\” stack in Rancher. That’s it! Rancher will immediately launch a new Jenkins slave container. As soon as the slave container starts, it will connect with Jenkins master and will show up in the list of build hosts:

jenkins\_scale\_up\_2

To scale down, select \“edit\” from jenkins-slave settings and adjust the number of slaves to your liking:

jenkins\_scale\_down

In a few seconds you’ll see the change reflected in Jenkins list of available build hosts. Behind the scenes, Rancher uses labels to schedule containers on hosts. For more details on Rancher’s container scheduling, we encourage you to check out the documentation.

Conclusion

In this article, we built Jenkins with Docker and Rancher. We deployed up a multi-node Jenkins platform with Rancher Compose which can be launched with a couple of commands and scaled as needed. Rancher’s cross-node networking allows us to seamlessly scale the Jenkins cluster on multiple nodes and potentially across multiple clouds with just a few clicks. Another significant aspect of our Jenkins stack is the DIND containers for Jenkins master and slave, which allows the Jenkins setup to be readily used for dockerized and non dockerized applications.

In future articles, we’re going to use this Jenkins stack to create build pipelines and highlight CI best practices for dockerized applications. To learn more about managing applications through the upgrade process, please join our next online meetup where we’ll dive into the details of how to manage deployments and upgrades of microservices with Docker and Rancher.

Source

Contributing to Kubernetes: Open-Source Citizenship

Feb 4, 2019

A Little Background

I’ve been using Kubernetes for a while now and decided it was time to be a responsible open-source citizen, and contribute some code. So I started combing their issue tracker, looking for a relatively small and straight-forward patch that I could cut my teeth on. If you’re also thinking of contributing to Kubernetes, I hope you can learn something from my experience.

Contributing to Kubernetes Opensource citizenship

First Steps

If you, too, have been looking to make your first-ever open source contribution, GitHub makes it easy to take the all-important first step of finding a beginner-friendly contrib opportunity. Look for issues marked good first issue or help wanted, and don’t forget to look at other projects in the Kubernetes organization.

If you’re still not sure how you can start contributing to Kubernetes, you can glean a lot of insight from a project’s test suite. Writing tests for existing functionality can help you find your bearings in a new codebase, and the maintainers will love you for it. Another option with a fairly low barrier to entry is contributing to Kubernetes documentation – there is even a whole website devoted to helping you get started doing just this. Again, the maintainers will love you for it.

In my case, I found an issue looking to add tests to ensure protobuf doesn’t break their API. That way, the maintainers can upgrade the protobuf dependency as needed without triggering any unpleasant surprises. A nice side effect of choosing this issue, in particular, was learning more about protobuf. Prior to starting, I knew what protobuf was, and even how to use it, but I had no idea how it actually worked. Protobuf internals are beyond the scope of this article, so here’s a link to a comprehensive overview.

Diving In

Once I decided what issue I was going to work on, I cloned the repo and started looking through the code. Kubernetes, for better or for worse, contains nearly 4,000,000 lines of code spread out across more than 13,000 files. Navigating a codebase this large can be daunting, to say the least, so diving in without a plan is definitely not advised.

One thing that can greatly narrow your search domain is identifying which packages or libraries you’ll need to dig into to accomplish your goals. My patch, for example, targets the apimachinery library. That cuts it down to around 60kloc across ~330 files. Now we’re getting somewhere!

Once you know where to look, a good understanding of how to search the source with tools like find and ack will be an invaluable asset, so it pays to brush up on their usage (the Linux man pages are a great place to start). You should ultimately be able to focus your attention on, at most, a handful of files.

Do Your Thing

The next step is to actually write your code. In my case, that meant adding a few tests to an existing file. If your patch is much larger in scope, then you should probably put it on hold, and find something smaller. It’s no fun to spend weeks writing something you’re proud of, only to have it rejected right off the bat.

I can’t provide much more guidance when it comes to writing your first patch. since every issue is unique. Hopefully, you didn’t bite off more than you could chew. Once you’re happy with your code and/or documentation, it’s time to submit your pull request. That can be a rather stressful experience for the uninitiated, and if you’re not used to very direct feedback, it can be hurt. Try not to take things too personally.

To minimize the pain, it’s a good idea to make sure your contribution is consistent with the existing codebase, and/or Documentation Style Guide. Also, make sure your git history is clean, by squashing and rebasing your working commits and checking the diffs against the latest master.

Read The Fine Print

Before your patch can be reviewed, you will have to sign the CNCF Contributor License Agreement, which grants the Cloud Native Computing Foundation additional rights and limitations not covered under the Apache-2.0 license that accompanies the project. While the CLA requirement definitely merits further discussion, this article is not the place to do it.

Once you’ve signed the CLA, make sure you read and follow the pull request template. In the same vein, you should pay special attention to the format and content of your commit message. Make sure that the message is clear and concise, and that it conveys the purpose of your changes/additions. If you’re not sure what format to use, I’m quite fond of:

topic: subtopic: Concise description of your patch here
For example, the commit message for my patch was:

apimachinery: protobuf: Test protobuf compatibility

Wait For It…

Now comes the hard part; waiting for review. Kubernetes is one of the most active projects on GitHub, and currently has over 1000 open pull requests, so it shouldn’t come as a surprise that you might have to wait a while before you get any feedback.

First, someone from the Kubernetes organization will triage your patch, and assign it to a suitable reviewer. If that person deems it safe, they will trigger the tests and review your code for style, correctness, and utility. You will probably need to make some changes, unless your patch is tiny and you’re a rock-star. Finally, once they’re happy with your patch, they’ll flag it with a ‘/LGTM’ message, and it will be automatically merged into Kubernetes’ master branch.

Congratulations, you’re now part of the CNCF/Kubernetes developer community! That wasn’t so bad, was it? Feel free to share your thoughts in the comments below, and ping me here or on Twitter if you have any questions or comments.

Source

Deploying an Elasticsearch Cluster using Rancher Catalog

Elasticsearch is a Lucene-based search engine developed by the
open-source vendor, elastic. With
principal features like scalability, resiliency, and top-notch
performance, it has overtaken Apache
Solr
, one of its closest competitors.
Nowadays, Elasticsearch is almost everywhere where a search engine is
involved: it’s the E of the well-known ELK
stack
, which
makes it straightforward for your project to process analytics (the L
stands for Logstash
which is used to process data like logs, streams, metrics; K stands for
Kibana, a data
visualization platform – projects also managed by elastic).
Installing Elasticsearch from the Rancher Catalog Before we get
started, let me tell you a bit about the Rancher
catalog
. The Rancher
catalog uses rancher-compose and docker-compose to ease the installation
of whatever tool you need. Using the Rancher catalog, you can deploy
everything from a simple app like ghost
(blogging platform) to a full CI/CD stack like
GoCD. I’ll assume here that you have a fully
working Rancher platform (a server and several nodes). If not, then
head over to the Rancher documentation
here, before going any
further in this article and set up your environment. My environment
looks like this (Figure 1, built using docker-machine on my laptop):
rachid
1-1

Figure *1: Elasticsearch Environment***

Accessing the Rancher catalog is simple:

  • On the top menu bar of your Rancher UI, click on Catalog, then
    All.
  • Using the search box on the upper right, search for
    *Elasticsearch***.
  • You’ll see two versions of Elasticsearch are available (Figure 2).
    Both work fine, but for this article, we’ll stick to version on the
    left.
  • Click on View Details. You will need to fill in some simple
    information (Figure 3).
  • To fire up the installation, click Launch.

Rachid
1-2

Figure *2: Elasticsearch Options in the Rancher Catalog***

rachid
1-3

Figure *3: Elasticsearch Data Form***

You should now see something similar to the image below (Figure 4).
You can find more details about what Rancher is doing by clicking on the
name of your stack (in my case, I’ve installed Elasticsearch, and named
my stack LocalEs). rachid
1-4

Figure *4: LocalEs app Naming Convention***

Expanding our view of the stack (Figure 5), we can see that deploying
an Elasticsearch cluster using the Rancher catalog template has
included:

  • a Master node
  • a Data node
  • a Client node
  • kopf, an
    Elasticsearch management web app

rachid
1-5

Figure *5: Elasticsearch Cluster Stack View***

Each of these nodes (except for kopf) comes with sidekick containers,
which in this case are configuration and data volume containers. Your
Elasticsearch cluster will be fully functional when all the entries are
“active”. If you want to see how they are all connected to each other,
take a look at the graph view (available from the drop-down menu
on the right hand corner in Figure 6). rachid
1-6

Figure *6: Elasticsearch Cluster Graph View***

Now, we can visualize how all these containers as they are mapped
within the Rancher platform (Figure 7). rachid
1-7

Figure *7: Elasticsearch Visual Map***

That’s it, our Elasticsearch cluster is now up and running. Let’s
see how our cluster behaves! Cluster Management Depending on your
Rancher setup, kopf is deployed on one of your Rancher nodes. You
can access the application using http://[your kopf rancher host].
Here’s an example (Figure 8): rachid
1-8

Figure *8: kopf node identification***

As you can see, everything seems to be fine, as
kopf shows a green
top bar. Indeed, our cluster is running without any data stored, so
there’s no need for resiliency at this point. Let’s see how it goes if
we manually create an index called ‘ranchercatalog’, with three shards
and two replicas. Using curl, your query would be something like this:

curl -XPUT ‘http://[your kopf rancher host]/es/ranchercatalog/’ -d ‘{
“settings” : {
“index” : {
“number_of_shards” : 3,
“number_of_replicas” : 2
}
}
}’

Elasticsearch should reply {“acknowledged”:true}% Shards are
related to data storage, and replicas to resiliency. This means our
index will have its data stored using three shards but needs two more
replicas of these shards. Now that our index has been successfully
created, let’s talk a look at
kopf. rachid
1-9

Figure *9: kopf Status View***

As you can see in Figure 9, the top bar is now yellow, which indicates
there may be something wrong with our Elasticsearch cluster. We can also
see in the middle left of the page a warning sign (red triangle in Fig.
9) saying “six unassigned shards.” Remember when we created the
ranchercatalog index, we specified:

  • Three shards
  • Two replicas

By default, the Elasticsearch Rancher catalog item deploys only 1 data
node, so we need two more data nodes. Adding nodes can be easily done
using the Rancher scale option. The results are shown in Figure 10.
rachid
1-10

Figure *10: Adding Nodes using Rancher Scale Option***

To scale your data nodes, let’s go again to Applications, then
to Stack. Click on your stack, and then on
elasticsearch-datanodes. You should have something like what is
shown in Figure 10. Click 2 times on the + of the scale option and
let Rancher do the work. You should see data nodes popping up one after
another until you finally have something like what you see in Figure 11.
rachid
1-11

Figure *11: Node View to Verify Additions***

Let’s check if this is enough to bring back the beautiful green bar
to kopf. Figure 12
provides the proof. Rachid
1-12

Figure *12: Corrected Nodes Verification***

Voilà! We now have a perfect and fully functional Elasticsearch
Cluster. In my next post, we’ll see how to populate this index and do
some cool queries! rachid
photo
*Rachid is a former virtualization consultant and Instructor. * After a
successful experience building and training the ops team of the French
registry AFNIC, he is now the CIO of a worldwide recognized CRM and
ecommerce agency.

Source

Microservices and Containers | Microservices Orchestration

Rancher Labs has been developing open source projects for about two
years now. We have a ton of GitHub repositories under our hood, and
our number keeps growing. The number of external contributions to our
projects keeps growing, too; Rancher has become more well-known over the
past year, and structural changes to our code base have made it easier
to contribute. So what are these structural changes? I would highlight 3
major ones:

  1. Moving key Rancher features into separate microservices projects
    (Metadata, DNS, Rancher compose, etc.)
  2. Dockerizing microservices orchestration
  3. Cataloging Dockerized application templates, and enabling them for
    deployment through the Rancher catalog

Item 2 acts as a bridge from 1 to 3. In this article, I will go over
each item in more detail.

Moving key Rancher features to microservices

It is well-known that monolithic systems come with certain
disadvantages:

  • Their code bases are not easy to understand and modify
  • Their features are hard to test in isolation
  • They have longer test and release cycles.

But even if your code base is pluggable and well-structured, the last
two challenges note above persist. Moving code into microservices helps
to overcome these challenges, and creates a lower threshold for external
committers: if you are new to open source development and willing to
start contributing, smaller projects are simply easier to grasp. In
addition, if you look at the project pull request history for Rancher
External DNS, you might see something interesting: DNS Service
Provide pull
requests
The majority of commits came from people with knowledge of
different service providers. From a contributor’s point of view, having
and bringing in specific service provider expertise reduces the pressure
associated with making initial contributions to the project. And of
course, the project benefits from getting all these provider extensions.

Dockerizing microservices

Let’s say as a contributor, you’ve created this new cool
DNSimple provider plug-in. It was released with an external-dns service,
and now you want to try it in Rancher. To adopt the changes, you
don’t have to wait for the next Rancher release, nor do you have to
change the Rancher code base. All you have to do is:

  • fetch the last released image from the external-dns dockerhub
    repo
  • create a docker-compose template with your service’s deployment
    details

docker-compose

  • Register your image in Rancher catalog
    repo
    (more on how to
    deploy it from Rancher catalog, in the next section).

Deploying the service through Rancher catalog

At Rancher, we want to provide an easy way for users to describe and
deploy their Docker-based applications. The Rancher catalog makes this
possible. By selecting an entry from the catalog, and answering several
questions, you can launch your service through the Rancher platform.
Screen Shot 2016-06-09 at 3.23.56
PM
All the services are grouped by category, so it is easy to search for a
specific functionality:

grouping by category

Pick your newly added DNSimple service, fill in the fields and hit
Launch: Screen Shot 2016-06-09 at 4.42.00
PM
That’s it! Your service gets deployed in Rancher, and can be discovered
and used by any other application. The catalog enables easy upgrades for
microservices. Once the new service image is available and its template
is published to the catalog, Rancher will get a notification, and
your service can be upgraded to the latest version in a rolling fashion.
The beauty of this is that you don’t have to update or upgrade Rancher
when a new version of a microservice gets released. Besides providing a
simple way of defining, deploying and upgrading microservices, the
Rancher Catalog acts as a shared template library. If you are interested
building an Elasticsearch microservice, using GlusterFS, or dockerizing
DroneCI, check out their corresponding catalog items. And if you want to
share your application, you can submit it to our Community catalog
repo
.

How microservices benefit Rancher as an orchestration platform

We’ve seen the single service implementation and deployment flow; let’s
look at the bigger picture now. Any container orchestration platform
should be easily extendable, especially when it comes to implementing a
specific service provider extension. Building and deploying this
extension shouldn’t be tightly coupled to the core platform, either.
Moving out the code to its own microservice repo, dockerizing the
service, and allowing it to deploy it using catalog, makes everything
easier to maintain and support (as pictured below): Rancher catalog
services
We are planning to move the rest of Rancher’s key services to their own
microservices. This will allow users to integrate the system service
plugins of their choice with just a couple of clicks.

Moving our key services – Metadata, Internal DNS – into dockerized
microservices written in Go has helped with the release management, and
driven more external commits. We’ve taken things one step further and
developed an application catalog where users can share their
applications’ templates in docker-compose format. This has taught us
more about best DevOps best practices from within our community, made us
more familiar with their use cases, and helped us improve our
microservices implementations. Working on an open source project is
always a two-way street – making your code easier to understand and
manage helps the community contribute to and enhance the project. We
have an awesome community, and appreciate every single contribution.
We will continue improving contributors’ experience and learning from
them.

Source

The History of Kubernetes & the Community Behind It

The History of Kubernetes & the Community Behind It

oscon award

It is remarkable to me to return to Portland and OSCON to stand on stage with members of the Kubernetes community and accept this award for Most Impactful Open Source Project. It was scarcely three years ago, that on this very same stage we declared Kubernetes 1.0 and the project was added to the newly formed Cloud Native Computing Foundation.

To think about how far we have come in that short period of time and to see the ways in which this project has shaped the cloud computing landscape is nothing short of amazing. The success is a testament to the power and contributions of this amazing open source community. And the daily passion and quality contributions of our endlessly engaged, world-wide community is nothing short of humbling.

Congratulations @kubernetesio for winning the “most impact” award at #OSCON I’m so proud to be a part of this amazing community! @CloudNativeFdn pic.twitter.com/5sRUYyefAK

— Jaice Singer DuMars (@jaydumars) July 19, 2018

👏 congrats @kubernetesio community on winning the #oscon Most Impact Award, we are proud of you! pic.twitter.com/5ezDphi6J6

— CNCF (@CloudNativeFdn) July 19, 2018

At a meetup in Portland this week, I had a chance to tell the story of Kubernetes’ past, its present and some thoughts about its future, so I thought I would write down some pieces of what I said for those of you who couldn’t be there in person.

It all began in the fall of 2013, with three of us: Craig McLuckie, Joe Beda and I were working on public cloud infrastructure. If you cast your mind back to the world of cloud in 2013, it was a vastly different place than it is today. Imperative bash scripts were only just starting to give way to declarative configuration of IaaS with systems. Netflix was popularizing the idea of immutable infrastructure but doing it with heavy-weight full VM images. The notion of orchestration, and certainly container orchestration existed in a few internet scale companies, but not in cloud and certainly not in the enterprise.

Docker changed all of that. By popularizing a lightweight container runtime and providing a simple way to package, distributed and deploy applications onto a machine, the Docker tooling and experience popularized a brand-new cloud native approach to application packaging and maintenance. Were it not for Docker’s shifting of the cloud developer’s perspective, Kubernetes simply would not exist.

I think that it was Joe who first suggested that we look at Docker in the summer of 2013, when Craig, Joe and I were all thinking about how we could bring a cloud native application experience to a broader audience. And for all three of us, the implications of this new tool were immediately obvious. We knew it was a critical component in the development of cloud native infrastructure.

But as we thought about it, it was equally obvious that Docker, with its focus on a single machine, was not the complete solution. While Docker was great at building and packaging individual containers and running them on individual machines, there was a clear need for an orchestrator that could deploy and manage large numbers of containers across a fleet of machines.

As we thought about it some more, it became increasingly obvious to Joe, Craig and I, that not only was such an orchestrator necessary, it was also inevitable, and it was equally inevitable that this orchestrator would be open source. This realization crystallized for us in the late fall of 2013, and thus began the rapid development of first a prototype, and then the system that would eventually become known as Kubernetes. As 2013 turned into 2014 we were lucky to be joined by some incredibly talented developers including Ville Aikas, Tim Hockin, Dawn Chen, Brian Grant and Daniel Smith.

Happy to see k8s team members winning the “most impact” award. #oscon pic.twitter.com/D6mSIiDvsU

— Bridget Kromhout (@bridgetkromhout) July 19, 2018

Kubernetes won the O’Reilly Most Impact Award. Thanks to our contributors and users! pic.twitter.com/T6Co1wpsAh

— Brian Grant (@bgrant0607) July 19, 2018

The initial goal of this small team was to develop a “minimally viable orchestrator.” From experience we knew that the basic feature set for such an orchestrator was:

  • Replication to deploy multiple instances of an application
  • Load balancing and service discovery to route traffic to these replicated containers
  • Basic health checking and repair to ensure a self-healing system
  • Scheduling to group many machines into a single pool and distribute work to them

Along the way, we also spent a significant chunk of our time convincing executive leadership that open sourcing this project was a good idea. I’m endlessly grateful to Craig for writing numerous whitepapers and to Eric Brewer, for the early and vocal support that he lent us to ensure that Kubernetes could see the light of day.

In June of 2014 when Kubernetes was released to the world, the list above was the sum total of its basic feature set. As an early stage open source community, we then spent a year building, expanding, polishing and fixing this initial minimally viable orchestrator into the product that we released as a 1.0 in OSCON in 2015. We were very lucky to be joined early on by the very capable OpenShift team which lent significant engineering and real world enterprise expertise to the project. Without their perspective and contributions, I don’t think we would be standing here today.

Three years later, the Kubernetes community has grown exponentially, and Kubernetes has become synonymous with cloud native container orchestration. There are more than 1700 people who have contributed to Kubernetes, there are more than 500 Kubernetes meetups worldwide and more than 42000 users have joined the #kubernetes-dev channel. What’s more, the community that we have built works successfully across geographic, language and corporate boundaries. It is a truly open, engaged and collaborative community, and in-and-of-itself and amazing achievement. Many thanks to everyone who has helped make it what it is today. Kubernetes is a commodity in the public cloud because of you.

But if Kubernetes is a commodity, then what is the future? Certainly, there are an endless array of tweaks, adjustments and improvements to the core codebase that will occupy us for years to come, but the true future of Kubernetes are the applications and experiences that are being built on top of this new, ubiquitous platform.

Kubernetes has dramatically reduced the complexity to build new developer experiences, and a myriad of new experiences have been developed or are in the works that provide simplified or targeted developer experiences like Functions-as-a-Service, on top of core Kubernetes-as-a-Service.

The Kubernetes cluster itself is being extended with custom resource definitions (which I first described to Kelsey Hightower on a walk from OSCON to a nearby restaurant in 2015), these new resources allow cluster operators to enable new plugin functionality that extend and enhance the APIs that their users have access to.

By embedding core functionality like logging and monitoring in the cluster itself and enabling developers to take advantage of such services simply by deploying their application into the cluster, Kubernetes has reduced the learning necessary for developers to build scalable reliable applications.

Finally, Kubernetes has provided a new, common vocabulary for expressing the patterns and paradigms of distributed system development. This common vocabulary means that we can more easily describe and discuss the common ways in which our distributed systems are built, and furthermore we can build standardized, re-usable implementations of such systems. The net effect of this is the development of higher quality, reliable distributed systems, more quickly.

It’s truly amazing to see how far Kubernetes has come, from a rough idea in the minds of three people in Seattle to a phenomenon that has redirected the way we think about cloud native development across the world. It has been an amazing journey, but what’s truly amazing to me, is that I think we’re only just now scratching the surface of the impact that Kubernetes will have. Thank you to everyone who has enabled us to get this far, and thanks to everyone who will take us further.

Brendan

Source