Securing the Configuration of Kubernetes Cluster Components

Securing the Configuration of Kubernetes Cluster Components

In the previous article of this series Securing Kubernetes for Cloud Native Applications, we discussed what needs to be considered when securing the infrastructure on which a Kubernetes cluster is deployed. This time around, we’re turning our attention to the cluster itself.

Kubernetes Architecture

Kubernetes is a complex system, and the diagram above shows the many different constituent parts that make up a cluster. Each of these components needs to be carefully secured in order to maintain the overall integrity of the cluster.

We won’t be able to cover every aspect of cluster-level security in this article, but we’ll aim to address the more important topics. As we’ll see later, help is available from the wider community, in terms of best-practice security for Kubernetes clusters, and the tooling for measuring adherence to that best-practice.

Cluster Installers

We should start with a brief observation about the many different tools that can be used to install the cluster components.

Some of the default configuration parameters for the components of a Kubernetes cluster, are sub-optimal from a security perspective, and need to be set correctly to ensure a secure cluster. Unless you opt for a managed Kubernetes cluster (such as that provided by Giant Swarm), where the entire cluster is managed on your behalf, this problem is exacerbated by the many different cluster installation tools available, each of which will apply a subtly different configuration. While most installers come with sane defaults, we should never consider that they have our backs covered when it comes to security, and we should make it our objective to ensure that whichever installer mechanism we elect to use, it’s configured to secure the cluster according to our requirements.

Let’s take a look at some of the important aspects of security for the control plane.

API Server

The API server is the hub of all communication within the cluster, and it’s on the API server where the majority of the cluster’s security configuration is applied. The API server is the only component of the cluster’s control plane, that is able to interact directly with the cluster’s state store. Users operating the cluster, other control plane components, and sometimes cluster workloads, all interact with the cluster using the server’s HTTP-based REST API.

Because of its pivotal role in the control of the cluster, carefully managing access to the API server is crucial as far as security is concerned. If somebody or something gains unsolicited access to the API, it may be possible for them to acquire all kinds of sensitive information, as well as gain control of the cluster itself. For this reason, client access to the Kubernetes API should be encrypted, authenticated, and authorized.

Securing Communication with TLS

To prevent man-in-the-middle attacks, the communication between each and every client and the API server should be encrypted using TLS. To achieve this, the API server needs to be configured with a private key and X.509 certificate.

The X.509 certificate for the root certificate authority (CA) that issued the API server’s certificate, must be available to any clients needing to authenticate to the API server during a TLS handshake, which leads us to the question of certificate authorities for the cluster in general. As we’ll see in a moment, there are numerous ways for clients to authenticate to the API server, and one of these is by way of X.509 certificates. If this method of client authentication is employed, which is probably true in the majority of cases (at least for cluster components), each cluster component should get its own certificate, and it makes a lot of sense to establish a cluster-wide PKI capability.

There are numerous ways that a PKI capability can be realised for a cluster, and no one way is better than another. It could be configured by hand, it may be configured courtesy of your chosen installer, or by some other means. In fact, the cluster can be configured to have its own in-built CA, that can issue certificates in response to certificate signing requests submitted via the API server. Here, at Giant Swarm, we use an operator called cert-operator, in conjunction with Hashicorp’s Vault.

Whilst we’re on the topic of secure communication with the API server, be sure to disable its insecure port (prior to Kubernetes 1.13), which serves the API over plain HTTP (–insecure-port=0)!

Authentication, Authorization, and Admission Control

Now let’s turn our attention to controlling which clients can perform which operations on which resources in the cluster. We won’t go into much detail here, as by and large, this is a topic for the next article. What’s important, is to make sure that the components of the control plane are configured to provide the underlying access controls.

Kubernetes API Authorization Flow

When an API request lands at the API server, it performs a series of checks to determine whether to serve the request or not, and if it does serve the request, whether to validate or mutate the the resource object according to defined policy. The chain of execution is depicted in the diagram above.

Kubernetes supports many different authentication schemes, which are almost always implemented externally to the cluster, including X.509 certificates, basic auth, bearer tokens, OpenID Connect (OIDC) for authenticating with a trusted identity provider, and so on. The various schemes are enabled using relevant config options on the API server, so be sure to provide these for the authentication scheme(s) you plan to use. X.509 client certificate authentication requires the path to a file containing one or more certificates for CAs (–client-ca-file), for example. One important point to remember, is that by default, any API requests that are not authenticated by one of the authentication schemes, are treated as anonymous requests. Whilst the access that anonymous requests gain can be limited by authorization, if they’re not required, they should be turned off altogether (–anonymous-auth=false).

Once a request is authenticated, the API server then considers the request against authorization policy. Again, the authorization modes are a configuration option (–authorization-mode), which should at the very least be altered from the default value of AlwaysAllow. The list of authorization modes ideally should include RBAC and Node, the former for enabling the RBAC API for fine-grained access control, and the latter to authorize kubelet API requests (see below).

Once an API request has been authenticated and authorized, the resource object can be subject to validation or mutation before it’s persisted to the cluster’s state database, using admission controllers. A minimum set of admission controllers are recommended for use, and shouldn’t be removed from the list, unless there is very good reason to do so. Additional security related admission controllers that are worthy of consideration are:

  • DenyEscalatingExec – if it’s necessary to allow your pods to run with enhanced privileges (e.g. using the host’s IPC/PID namespaces), this admission controller will prevent users from executing commands in the pod’s privileged containers.
  • PodSecurityPolicy – provides the means for applying various security mechanisms for all created pods. We’ll discuss this further in the next article in this series, but for now it’s important to ensure this admission controller is enabled, otherwise our security policy cannot be applied.
  • NodeRestriction – an admission controller that governs the access a kubelet has to cluster resources, which is covered in more detail below.
  • ImagePolicyWebhook – allows for the images defined for a pod’s containers, to be checked for vulnerabilities by an external ‘image validator’, such as the Image Enforcer. Image Enforcer is based on the Open Policy Agent (OPA), and works in conjunction with the open source vulnerability scanner, Clair.

Dynamic admission control, which is a relatively new feature in Kubernetes, aims to provide much greater flexibility over the static plugin admission control mechanism. It’s implemented with admission webhooks and controller-based initializers, and promises much for cluster security, just as soon as community solutions reach a level of sufficient maturity.

Kubelet

The kubelet is an agent that runs on each node in the cluster, and is responsible for all pod-related activities on the node that it runs on, including starting/stopping and restarting pod containers, reporting on the health of pod containers, amongst other things. After the API server, the kubelet is the next most important cluster component to consider when it comes to security.

Accessing the Kubelet REST API

The kubelet serves a small REST API on ports 10250 and 10255. Port 10250 is a read/write port, whilst 10255 is a read-only port with a subset of the API endpoints.

Providing unfettered access to port 10250 is dangerous, as it’s possible to execute arbitrary commands inside a pod’s containers, as well as start arbitrary pods. Similarly, both ports provide read access to potentially sensitive information concerning pods and their containers, which might render workloads vulnerable to compromise.

To safeguard against potential compromise, the read-only port should be disabled, by setting the kubelet’s configuration, –read-only-port=0. Port 10250, however, needs to be available for metrics collecting and other important functions. Access to this port should be carefully controlled, so let’s discuss the key security configurations.

Client Authentication

Unless its specifically configured, the kubelet API is open to unauthenticated requests from clients. It’s important, therefore, to configure one of the available authentication methods; X.509 client certificates, or requests with Authorization headers containing bearer tokens.

In the case of X.509 client certificates, the contents of a CA bundle needs to be made available to the kubelet, so that it can authenticate the certificates presented by clients during a TLS handshake. This is provided as part of the kubelet configuration (–client-ca-file).

In an ideal world, the only client that needs access to a kubelet’s API, is the Kubernetes API server. It needs to access the kubelet’s API endpoints for various functions, such as collecting logs and metrics, executing a command in a container (think kubectl exec), forwarding a port to a container, and so on. In order for it to be authenticated by the kubelet, the API server needs to be configured with client TLS credentials (–kubelet-client-certificate and –kubelet-client-key).

Anonymous Authentication

If you’ve taken the care to configure the API server’s access to the kubelet’s API, you might be forgiven for thinking ‘job done’. But this isn’t the case, as any requests hitting the kubelet’s API that don’t attempt to authenticate with the kubelet, are deemed to be anonymous requests. By default, the kubelet passes anonymous requests on for authorization, rather than rejecting them as unauthenticated.

If it’s essential in your environment to allow for anonymous kubelet API requests, then there is the authorization gate, which gives some flexibility in determining what can and can’t get served by the API. It’s much safer, however, to disallow anonymous API requests altogether, by setting the kubelet’s –anonymous-auth configuration to false. With such a configuration, the API returns a 401 Unauthorized response to unauthorized clients.

Authorization

With authorizing requests to the kubelet API, once again it’s possible to fall foul of a default Kubernetes setting. Authorization to the kubelet API operates in one of two modes; AlwaysAllow (default) or Webhook. The AlwaysAllow mode does exactly what you’d expect – it will allow all requests that have passed through the authentication gate, to succeed. This includes anonymous requests.

Instead of leaving this wide open, the best approach is to offload the authorization decision to the Kubernetes API server, using the kubelet’s –authorization-mode config option, with the webhook value. With this configuration, the kubelet calls the SubjectAccessReview API (which is part of the API server) to determine whether the subject is allowed to make the request, or not.

Restricting the Power of the Kubelet

In older versions of Kubernetes (prior to 1.7), the kubelet had read-write access to all Node and Pod API objects, even if the Node and Pod objects were under the control of another kubelet running on a different node. They also had read access to all objects that were contained within pod specs; the Secret, ConfigMap, PersistentVolume and PersistentVolumeClaim objects. In other words, a kubelet had access to, and control of, numerous resources it had no responsibility for. This is very powerful, and in the event of a cluster node compromise, the damage could quickly escalate beyond the node in question.

Node Authorizer

For this reason, a Node Authorization mode was introduced specifically for the kubelet, with the goal of controlling its access to the Kubernetes API. The Node authorizer limits the kubelet to read operations on those objects that are relevant to the kubelet (e.g. pods, nodes, services), and applies further read-only limits to Secrets, Configmap, PersistentVolume and PersistentVolumeClaim objects, that are related specifically to the pods bound to the node on which the kubelet runs.

NodeRestriction Admission Controller

Limiting a kubelet to read-only access for those objects that are relevant to it, is a big step in preventing a compromised cluster or workload. The kubelet, however, needs write access to its Node and Pod objects as a means of its normal function. To allow for this, once a kubelet’s API request has passed through Node Authorization, it’s then subject to the NodeRestriction admission controller, which limits the Node and Pod objects the kubelet can modify – its own. For this to work, the kubelet user must be system:node:<nodeName>, which must belong in the system:nodes group. It’s the nodeName component of the kubelet user, of course, which the NodeRestriction admission controller uses to allow or disallow kubelet API requests that modify Node and Pod objects. It follows, that each kubelet should have a unique X.509 certificate for authenticating to the API server, with the Common Name of the subject distinguished name reflecting the user, and the Organization reflecting the group.

Again, these important configurations don’t happen automagically, and the API server needs to be started with Node as one of the comma-delimited list of plugins for the –authorization-mode config option, whilst NodeRestriction needs to be in the list of admission controllers specified by the –enable-admission-plugins option.

Best Practice

It’s important to emphasize that we’ve only covered a sub-set of of the security considerations for the cluster layer (albeit important ones), and if you’re thinking that this all sounds very daunting, then fear not, because help is at hand.

In the same way that benchmark security recommendations have been created for elements of the infrastructure layer, such as Docker, they have also been created for a Kubernetes cluster. The Center for Internet Security (CIS) have compiled a thorough set of configuration settings and filesystem checks for each component of the cluster, published as the CIS Kubernetes Benchmark.

You might also be interested to know that the Kubernetes community has produced an open source tool for auditing a Kubernetes cluster against the benchmark, the Kubernetes Bench for Security. It’s a Golang application, and supports a number of different Kubernetes versions (1.6 onwards), as well as different versions of the benchmark.

If you’re serious about properly securing your cluster, then using the benchmark as a measure of compliance, is a must.

Summary

Evidently, taking precautionary steps to secure your cluster with appropriate configuration, is crucial to protecting the workloads that run in the cluster. Whilst the Kubernetes community has worked very hard to provide all of the necessary security controls to implement that security, for historical reasons some of the default configuration overlooks what’s considered best-practice. We ignore these shortcomings at our peril, and must take the responsibility for closing the gaps whenever we establish a cluster, or when we upgrade to newer versions that provide new functionality.

Some of what we’ve discussed here, paves the way for the next layer in the stack, where we make use of the security mechanisms we’ve configured, to define and apply security controls to protect the workloads that run on the cluster. The next article is called Applying Best Practice Security Controls to a Kubernetes Cluster.

Source

What’s New in Kubernetes 1.13

Banner

As the year comes to a close, Kubernetes contributors, our engineers included, have been hard at work to bring you the final release of 2018: Kubernetes 1.13. In recognition of the achievements the community has made this year, and the looming holiday season, we shift our focuses towards presenting this work to the world at large. KubeCon Shanghai was merely weeks ago and KubeCon NA (Seattle) kicks off next week!

That said, the Kubernetes 1.13 release cycle has been significantly shorter. Given the condensed timeline to plan, document, and deliver enhancements to the Kubernetes ecosystem, efforts were dedicated to minimizing new functionality and instead optimizing existing APIs, graduating major features, improving documentation, and strengthening the test suites within core Kubernetes and the associated components. So yet again, the common theme is stability. Let’s dive into some of the highlights of the release!

Storage

One of the major highlights in this release is CSI (Container Storage Interface), which was first introduced as alpha in January. CSI support in Kubernetes is now Generally Available.

In its infancy, Kubernetes was primarily geared towards running stateless applications. Since then, we’ve seen the evolution of constructs like PetSets evolve into StatefulSets, to build more robust support for running stateful applications. In keeping with that evolution, the Storage Special Interest Group (SIG) has made consistent improvements to the way Kubernetes interfaces with storage subsystems. These developments strengthen the community’s ability to provide storage guarantees to applications running within Kubernetes, which is of paramount importance, especially for Enterprise customers using technologies like Ceph and Gluster.

Making Declarative Changes Safer

At the risk of providing a simplistic explanation, Kubernetes is a set of APIs that receive declarative information from operators / other systems, process and store that information in a key-value store (etcd), and then query and act on the stored information to achieve some desired state. There are then reconciliation loops spread across multiple controllers to enable that the desired state is always maintained. It is important that the changes made to these systems are made in a safe way, as consequences can ripple out to multiples places in a Kubernetes environment.

To that end, we’d like to highlight two enhancements: APIServer DryRun and kubectl diff.

If flags like –dry-run or –apply=false in CLI tools sound familiar, then APIServer DryRun will too. APIServer DryRun is an enhancement which allows cluster operators to understand what would’ve happened with common operations (POST, PUT, PATCH, DELETE) on Kubernetes objects, without persisting the data of the proposed change. This brings an opportunity to better introspect on desired changes, without the burden of having to potentially rollback errors. DryRun has moved to beta in Kubernetes 1.13.

Similarly, kubectl diff provides a similar experience to using the diff utility. Prior to the introduction of this enhancement, operators would have to carefully compare objects to interpolate what the results of the change would be. Moving to beta in Kubernetes 1.13, users can now inspect a local declared Kubernetes object and compare that to the state of a running in-cluster object, or a previously applied object, or what the merging of two objects would result in.

Plugin Systems

As the Kubernetes ecosystem expands, the community has embraced separating the core codebase into new projects, which improve developer velocity, as well as help to minimize the size of the binaries that are delivered. A direct effect of this has been the requirement to extend the way Kubernetes core discovers and gains visibility into external components. This can include a wide gamut of components, like CRI (Container Runtime Interface) and GPU-enabled devices.

To make this happen, an enhancement called Kubelet Device Plugin Registration was introduced in 1.11 and graduates to GA in Kubernetes 1.13. Device plugin registration provides a common and consistent interface which plugins can register against in the kubelet.

Once new device plugins are integrated into the system, it becomes yet another vector that we want to gain visibility into. Third-party device monitoring is now in alpha for Kubernetes 1.13, and it seeks to solve that need. With this new enhancement, third-party device makers can route their custom information to the Kubernetes monitoring systems. This means GPU compute can now be monitored in a similar way as standard cluster resources like RAM and CPU are already monitored.

Collaboration is Key

The community has worked hard on this release, and it caps off a year that could best be summed up by a single word: Cooperation. More consistent, open source tools have emerged, like CNI, CRI, CSI, kubeadm, and CoreDNS to name a few.

Expect 2019 to see a continued push to enable the community through better interfaces, APIs and plugins.

To get started with the latest Kubernetes release you can find it on GitHub at https://github.com/kubernetes/kubernetes/releases.

Source

Kubernetes 1.13: Simplified Cluster Management with Kubeadm, Container Storage Interface (CSI), and CoreDNS as Default DNS are Now Generally Available

Kubernetes 1.13: Simplified Cluster Management with Kubeadm, Container Storage Interface (CSI), and CoreDNS as Default DNS are Now Generally Available

Author: The 1.13 Release Team

We’re pleased to announce the delivery of Kubernetes 1.13, our fourth and final release of 2018!

Kubernetes 1.13 has been one of the shortest releases to date at 10 weeks. This release continues to focus on stability and extensibility of Kubernetes with three major features graduating to general availability this cycle in the areas of Storage and Cluster Lifecycle. Notable features graduating in this release include: simplified cluster management with kubeadm, Container Storage Interface (CSI), and CoreDNS as the default DNS.

These stable graduations are an important milestone for users and operators in terms of setting support expectations. In addition, there’s a continual and steady stream of internal improvements and new alpha features that are made available to the community in this release. These features are discussed in the “additional notable features” section below.

Let’s dive into the key features of this release:

Simplified Kubernetes Cluster Management with kubeadm in GA

Most people who have gotten hands-on with Kubernetes have at some point been hands-on with kubeadm. It’s an essential tool for managing the cluster lifecycle, from creation to configuration to upgrade; and now kubeadm is officially GA. kubeadm handles the bootstrapping of production clusters on existing hardware and configuring the core Kubernetes components in a best-practice-manner to providing a secure yet easy joining flow for new nodes and supporting easy upgrades. What’s notable about this GA release are the now graduated advanced features, specifically around pluggability and configurability. The scope of kubeadm is to be a toolbox for both admins and automated, higher-level system and this release is a significant step in that direction.

Container Storage Interface (CSI) Goes GA

The Container Storage Interface (CSI) is now GA after being introduced as alpha in v1.9 and beta in v1.10. With CSI, the Kubernetes volume layer becomes truly extensible. This provides an opportunity for third party storage providers to write plugins that interoperate with Kubernetes without having to touch the core code. The specification itself has also reached a 1.0 status.

With CSI now stable, plugin authors are developing storage plugins out of core, at their own pace. You can find a list of sample and production drivers in the CSI Documentation.

CoreDNS is Now the Default DNS Server for Kubernetes

In 1.11, we announced CoreDNS had reached General Availability for DNS-based service discovery. In 1.13, CoreDNS is now replacing kube-dns as the default DNS server for Kubernetes. CoreDNS is a general-purpose, authoritative DNS server that provides a backwards-compatible, but extensible, integration with Kubernetes. CoreDNS has fewer moving parts than the previous DNS server, since it’s a single executable and a single process, and supports flexible use cases by creating custom DNS entries. It’s also written in Go making it memory-safe.

CoreDNS is now the recommended DNS solution for Kubernetes 1.13+. The project has switched the common test infrastructure to use CoreDNS by default and we recommend users switching as well. KubeDNS will still be supported for at least one more release, but it’s time to start planning your migration. Many OSS installer tools have already made the switch, including Kubeadm in 1.11. If you use a hosted solution, please work with your vendor to understand how this will impact you.

Additional Notable Feature Updates

Support for 3rd party device monitoring plugins has been introduced as an alpha feature. This removes current device-specific knowledge from the kubelet to enable future use-cases requiring device-specific knowledge to be out-of-tree.

Kubelet Device Plugin Registration is graduating to stable. This creates a common Kubelet plugin discovery model that can be used by different types of node-level plugins, such as device plugins, CSI and CNI, to establish communication channels with Kubelet.

Topology Aware Volume Scheduling is now stable. This make the scheduler aware of a Pod’s volume’s topology constraints, such as zone or node.

APIServer DryRun is graduating to beta. This moves “apply” and declarative object management from kubectl to the apiserver in order to fix many of the existing bugs that can’t be fixed today.

Kubectl Diff is graduating to beta. This allows users to run a kubectl command to view the difference between a locally declared object configuration and the current state of a live object.

Raw block device using persistent volume source is graduating to beta. This makes raw block devices (non-networked) available for consumption via a Persistent Volume Source.

Each Special Interest Group (SIG) within the community continues to deliver the most-requested enhancements, fixes, and functionality for their respective specialty areas. For a complete list of inclusions by SIG, please visit the release notes.

Availability

Kubernetes 1.13 is available for download on GitHub. To get started with Kubernetes, check out these interactive tutorials. You can also easily install 1.13 using kubeadm.

Features Blog Series

If you’re interested in exploring these features more in depth, check back tomorrow for our 5 Days of Kubernetes series where we’ll highlight detailed walkthroughs of the following features:

  • Day 1 – Simplified Kubernetes Cluster Creation with Kubeadm
  • Day 2 – Out-of-tree CSI Volume Plugins
  • Day 3 – Switch default DNS plugin to CoreDNS
  • Day 4 – New CLI Tips and Tricks (Kubectl Diff and APIServer Dry run)
  • Day 5 – Raw Block Volume

Release team

This release is made possible through the effort of hundreds of individuals who contributed both technical and non-technical content. Special thanks to the release team led by Aishwarya Sundar, Software Engineer at Google. The 39 individuals on the release team coordinate many aspects of the release, from documentation to testing, validation, and feature completeness.

As the Kubernetes community has grown, our release process represents an amazing demonstration of collaboration in open source software development. Kubernetes continues to gain new users at a rapid clip. This growth creates a positive feedback cycle where more contributors commit code creating a more vibrant ecosystem. Kubernetes has over 25,000 individual contributors to date and an active community of more than 51,000 people.

Project Velocity

The CNCF has continued refining DevStats, an ambitious project to visualize the myriad contributions that go into the project. K8s DevStats illustrates the breakdown of contributions from major company contributors, as well as an impressive set of preconfigured reports on everything from individual contributors to pull request lifecycle times. On average over the past year, 347 different companies and over 2,372 individuals contribute to Kubernetes each month. Check out DevStats to learn more about the overall velocity of the Kubernetes project and community.

User Highlights

Established, global organizations are using Kubernetes in production at massive scale. Recently published user stories from the community include:

Is Kubernetes helping your team? Share your story with the community.

Ecosystem Updates

  • CNCF recently released the findings of their bi-annual CNCF survey in Mandarin, finding that cloud usage in Asia has grown 135% since March 2018.
  • CNCF expanded its certification offerings to include a Certified Kubernetes Application Developer exam. The CKAD exam certifies an individual’s ability to design, build, configure, and expose cloud native applications for Kubernetes. More information can be found here.
  • CNCF added a new partner category, Kubernetes Training Partners (KTP). KTPs are a tier of vetted training providers who have deep experience in cloud native technology training. View partners and learn more here.
  • CNCF also offers online training that teaches the skills needed to create and configure a real-world Kubernetes cluster.
  • Kubernetes documentation now features user journeys: specific pathways for learning based on who readers are and what readers want to do. Learning Kubernetes is easier than ever for beginners, and more experienced users can find task journeys specific to cluster admins and application developers.

KubeCon

The world’s largest Kubernetes gathering, KubeCon + CloudNativeCon is coming to Seattle from December 10-13, 2018 and Barcelona from May 20-23, 2019. This conference will feature technical sessions, case studies, developer deep dives, salons, and more. Registration will open up in early 2019.

Webinar

Join members of the Kubernetes 1.13 release team on January 10th at 9am PDT to learn about the major features in this release. Register here.

Get Involved

The simplest way to get involved with Kubernetes is by joining one of the many Special Interest Groups (SIGs) that align with your interests. Have something you’d like to broadcast to the Kubernetes community? Share your voice at our weekly community meeting, and through the channels below.

Thank you for your continued feedback and support.

Source

NextCloudPi updated to NC14.0.4, brings HDD monitoring, OrangePi, VM and more – Own your bits

The latest release of NextCloudPi is out!

This release brings the latest major version of Nextcloud, as well as more platforms and tools for monitoring our hard drive health. As usual this release includes many small fixes and improvements, noticeably a new faster version of btrfs-sync.

We are still looking for people to help us support more boards. If you own a BananaPi, OrangePi, Pine64 or any other not yet supported board talk to us. We only need some of your time to perform a quick test in the new images every few months.

We are also in need translators, more automated testing, and some web devs to take on the web interface and improve the user experience.

NextCloudPi improves everyday thanks to your feedback. Please report any problems here. Also, you can discuss anything in the forums, or hang out with us in Telegram.

Last but not least, please download through bitorrent and share it for a while to help keep hosting costs down.

Nextcloud 14.0.4

We have been upgrading to every minor release and now we release an image with version 14.0.4 so new users don’t need to upgrade from 14.0.1. This is basically a more polished Nextcloud version without any new features, as you can see in the changelog.

Remember that it is recommended to upgrade through nc-update-nextcloud instead of the native Nextcloud installer, and that you have the option to let NextCloudPi automatically upgrade by activating nc-autoupdate-nc.

Check and monitor your hard drive health

We already introduced SMART in a previous post, so it was a given that this would be soon included in NextCloudPi! We can check our drive health with nc-hdd-test

We can choose between long and short tests as explained in the previous post.

We can also monitor our drive’s health and get notified via email so that we can hopefully take action before the drive fails

We will also receive a Nextcloud notification

OrangePi images

We are now including Orange Pi images for the Zero Plus 2 version. This board features fast Gigabit networking speeds, and nice eMMC storage, and is capable of displaying 2K graphics, which makes it a popular choice for a NAS + Media Center combo.

NextCloudPi VM

The VM provides a convenient way of installing NCP on a virtual machine, instead of the classic way of using the curl installer.

See details in this previous post.
Source

Continuous Delivery of Everything with Rancher, Drone, and Terraform

It’s 8:00 PM. I just deployed to production, but nothing’s working.
Oh, wait. the production Kinesis stream doesn’t exist, because the
CloudFormation template for production wasn’t updated.
Okay, fix that.
9:00 PM. Redeploy. Still broken. Oh, wait. The production config file
wasn’t updated to use the new database.
Okay, fix that. Finally, it
works, and it’s time to go home. Ever been there? How about the late
night when your provisioning scripts work for updating existing servers,
but not for creating a brand new environment? Or, a manual deployment
step missing from a task list? Or, a config file pointing to a resource
from another environment? Each of these problems stems from separating
the activity of provisioning infrastructure from that of deploying
software, whether by choice, or limitation of tools. The impact of
deploying should be to allow customers to benefit from added value or
validate a business hypothesis. In order to accomplish this,
infrastructure and software are both needed, and they normally change
together. Thus, a deployment can be defined as:

  • reconciling the infrastructure needed with the infrastructure that
    already exists; and
  • reconciling the software that we want to run with the software that
    is already running.

With Rancher, Terraform, and Drone, you can build a continuous delivery
pipeline that lets you deploy this way. Let’s look at a sample system:
This simple
architecture has a server running two microservices,
[happy-service]
and
[glad-service].
When a deployment is triggered, you want the ecosystem to match this
picture, regardless of what its current state is. Terraform is a tool
that allows you to predictably create and change infrastructure and
software. You describe individual resources, like servers and Rancher
stacks, and it will create a plan to make the world match the resources
you describe. Let’s create a Terraform configuration that creates a
Rancher environment for our production deployment:

provider “rancher” {
api_url = “$”
}

resource “rancher_environment” “production” {
name = “production”
description = “Production environment”
orchestration = “cattle”
}

resource “rancher_registration_token” “production_token” {
environment_id = “$”
name = “production-token”
description = “Host registration token for Production environment”
}

Terraform has the ability to preview what it’ll do before applying
changes. Let’s run terraform plan.

+ rancher_environment.production
description: “Production environment”

+ rancher_registration_token.production_token
command: “<computed>”

The pluses and green text indicate that the resource needs to be
created. Terraform knows that these resources haven’t been created yet,
so it will try to create them. Running terraform apply creates the
environment in Rancher. You can log into Rancher to see it. Now let’s
add an AWS EC2 server to the environment:

# A look up for rancheros_ami by region
variable “rancheros_amis” {
default = {
“ap-south-1” = “ami-3576085a”
“eu-west-2” = “ami-4806102c”
“eu-west-1” = “ami-64b2a802”
“ap-northeast-2” = “ami-9d03dcf3”
“ap-northeast-1” = “ami-8bb1a7ec”
“sa-east-1” = “ami-ae1b71c2”
“ca-central-1” = “ami-4fa7182b”
“ap-southeast-1” = “ami-4f921c2c”
“ap-southeast-2” = “ami-d64c5fb5”
“eu-central-1” = “ami-8c52f4e3”
“us-east-1” = “ami-067c4a10”
“us-east-2” = “ami-b74b6ad2”
“us-west-1” = “ami-04351964”
“us-west-2” = “ami-bed0c7c7”
}
type = “map”
}

# this creates a cloud-init script that registers the server
# as a rancher agent when it starts up
resource “template_file” “user_data” {
template = <<EOF
#cloud-config
write_files:
– path: /etc/rc.local
permissions: “0755”
owner: root
content: |
#!/bin/bash
for i in
do
docker info && break
sleep 1
done
sudo docker run -d –privileged -v /var/run/docker.sock:/var/run/docker.sock -v /var/lib/rancher:/var/lib/rancher rancher/agent:v1.2.1 $$
EOF

vars {
registration_url = “$”
}
}

# AWS ec2 launch configuration for a production rancher agent
resource “aws_launch_configuration” “launch_configuration” {
provider = “aws”
name = “rancher agent”
image_id = “$”
instance_type = “t2.micro”
key_name = “$”
user_data = “$”

security_groups = [ “$”]
associate_public_ip_address = true
}

# Creates an autoscaling group of 1 server that will be a rancher agent
resource “aws_autoscaling_group” “autoscaling” {
availability_zones = [“$”]
name = “Production servers”
max_size = “1”
min_size = “1”
health_check_grace_period = 3600
health_check_type = “ELB”
desired_capacity = “1”
force_delete = true
launch_configuration = “$”
vpc_zone_identifier = [“$”]
}

We’ll put these in the same directory as environment.tf, and run
terraform plan again:

+ aws_autoscaling_group.autoscaling
arn: “”

+ aws_launch_configuration.launch_configuration
associate_public_ip_address: “true”

+ template_file.user_data

This time, you’ll see that rancher_environment resources is missing.
That’s because it’s already created, and Rancher knows that it
doesn’t have to create it again. Run terraform apply, and after a few
minutes, you should see a server show up in Rancher. Finally, we want to
deploy the happy-service and glad-service onto this server:

resource “rancher_stack” “happy” {
name = “happy”
description = “A service that’s always happy”
start_on_create = true
environment_id = “$”

docker_compose = <<EOF
version: ‘2’
services:
happy:
image: peloton/happy-service
stdin_open: true
tty: true
ports:
– 8000:80/tcp
labels:
io.rancher.container.pull_image: always
io.rancher.scheduler.global: ‘true’
started: $STARTED
EOF

rancher_compose = <<EOF
version: ‘2’
services:
happy:
start_on_create: true
EOF

finish_upgrade = true
environment {
STARTED = “$”
}
}

resource “rancher_stack” “glad” {
name = “glad”
description = “A service that’s always glad”
start_on_create = true
environment_id = “$”

docker_compose = <<EOF
version: ‘2’
services:
glad:
image: peloton/glad-service
stdin_open: true
tty: true
ports:
– 8000:80/tcp
labels:
io.rancher.container.pull_image: always
io.rancher.scheduler.global: ‘true’
started: $STARTED
EOF

rancher_compose = <<EOF
version: ‘2’
services:
glad:
start_on_create: true
EOF

finish_upgrade = true
environment {
STARTED = “$”
}
}

This will create two new Rancher stacks; one for the happy service and
one for the glad service. Running terraform plan once more will show
the two Rancher stacks:

+ rancher_stack.glad
description: “A service that’s always glad”

+ rancher_stack.happy
description: “A service that’s always happy”

And running terraform apply will create them. Once this is done,
you’ll have your two microservices deployed onto a host automatically
on Rancher. You can hit your host on port 8000 or on port 8001 to see
the response from the services:
We’ve created each
piece of the infrastructure along the way in a piecemeal fashion. But
Terraform can easily do everything from scratch, too. Try issuing a
terraform destroy, followed by terraform apply, and the entire
system will be recreated. This is what makes deploying with Terraform
and Rancher so powerful – Terraform will reconcile the desired
infrastructure with the existing infrastructure, whether those resources
exist, don’t exist, or require modification. Using Terraform and
Rancher, you can now create the infrastructure and the software that
runs on the infrastructure together. They can be changed and versioned
together, too. In the future blog entries, we’ll look at how to
automate this process on git push with Drone. Be sure to check out the
code for the Terraform configuration are hosted on
[github].
The
[happy-service]
and
[glad-service]
are simple nginx docker containers. Bryce Covert is an engineer at
pelotech. By day, he helps teams accelerate
engineering by teaching them functional programming, stateless
microservices, and immutable infrastructure. By night, he hacks away,
creating point and click adventure games. You can find pelotech on
Twitter at @pelotechnology.

Source

Microservices Made Easier Using Istio


Expert Training in Kubernetes and Rancher

Join our free online training sessions to learn how to manage Kubernetes workloads with Rancher.

Sign up here

Update: This tutorial on Istio was updated for Rancher 2.0 here.

One of the recent open source initiatives that has caught our interest
at Rancher Labs is Istio, the micro-services
development framework. It’s a great technology, combining some of the
latest ideas in distributed services architecture in an easy-to-use
abstraction. Istio does several things for you. Sometimes referred to as
a “service mesh“, it has facilities for API
authentication/authorization, service routing, service discovery,
request monitoring, request rate-limiting, and more. It’s made up of a
few modular components that can be consumed separately or as a whole.
Some of the concepts such as “circuit breakers” are so sensible I
wonder how we ever got by without them.

Circuit breakers
are a solution to the problem where a service fails and incoming
requests cannot be handled. This causes the dependent services making
those calls to exhaust all their connections/resources, either waiting
for connections to timeout or allocating memory/threads to create new
ones. The circuit breaker protects the dependent services by
“tripping” when there are too many failures in a some interval of
time, and then only after some cool-down period, allowing some
connections to retry (effectively testing the waters to see if the
upstream service is ready to handle normal traffic again).

Istio is
built with Kubernetes in mind. Kubernetes is a
great foundation as it’s one of the fastest growing platforms for
running container systems, and has extensive community support as well
as a wide variety of tools. Kubernetes is also built for scale, giving
you a foundation that can grow with your application.

Deploying Istio with Helm

Rancher includes and enterprise Kubernetes distribution makes it easy to
run Istio. First, fire up a Kubernetes environment on Rancher (watch
this
demo
or see our quickstart
guide
for
help). Next, use the helm chart from the Kubernetes Incubator for
deploying Istio to start the framework’s components. You’ll need to
install helm, which you can do by following this
guide
.
Once you have helm installed, you can add the helm chart repo from
Google to your helm client:

helm repo add incubator http://storage.googleapis.com/kubernetes-charts-incubator

Then you can simply run:

helm install -n istio incubator/istio


A view in kube dash of the microservices that makeup Istio
This will deploy a few micro-services that provide the functionality of
Istio. Istio gives you a framework for exchanging messages between
services. The advantage of using it over building your own is you don’t
have to implement as much “boiler-plate” code before actually writing
the business logic of your application. For instance, do you need to
implement auth or ACLs between services? It’s quite possible that your
needs are the same as most other developers trying to do the same, and
Istio offers a well-written solution that just works. Its also has a
community of developers whose focus is to make this one thing work
really well, and as you build your application around this framework, it
will continue to benefit from this innovation with minimal effort on
your part.

Deploying an Istio Application

OK, so lets try this thing out. So far all we have is plumbing. To
actually see it do something you’ll want to deploy an Istio
application. The Istio team have put together a nice sample application
they call ”BookInfo” to
demonstrate how it works. To work with Istio applications we’ll need
two things: the Istio command line client, istioctl, and the Istio
application templates. The istioctl client works in conjunction with
kubectl to deploy Istio applications. In this basic example,
istioctl serves as a preprocessor for kubectl, so we can dynamically
inject information that is particular to our Istio deployment.
Therefore, in many ways, you are working with normal Kubernetes resource
YAML files, just with some hooks where special Istio stuff can be
injected. To make it easier to get started, you can get both istioctl
and the needed application templates from this repo:
https://github.com/wjimenez5271/rancher-istio. Just clone it on your
local machine. This also assumes you have kubectl installed and
configured. If you need help installing that see our
docs.
Now
that you’ve cloned the above repo, “cd” into the directory and run:

kubectl apply -f <(istioctl kube-inject -f samples/apps/bookinfo/bookinfo.yaml)

This deploys the kubernetes resources using kubectl while injecting some
istio specific values. It will deploy new services to K8 that will serve
the “BookInfo” application, but it will leverage the Istio services
we’ve already deployed. Once the BookInfo services finish deploying we
should be able to view the UI of the web app. We’ll need to get the
address first, we can do that by running

kubectl get services istio-ingress -o wide

This should show you the IP address of the istio ingress (under the
EXTERNAL-IP column). We’ll use this IP address to construct the URL to
access the application. For example, my output with my local Rancher
install looks like:
Example output of kubectl get services istio-ingress -o wide
The istio ingress is shared amongst your applications, and routes to the
correct service based on a URI pattern. Our application route is at
/productpage so our request URL would be:

http://$EXTERNAL_IP/productpage

Try loading that in your browser. If everything worked you should see
a page like this:
Sample application “BookInfo“, built on Istio

Built-in metrics system

Now that we’ve got our application working we can check out the built
in metrics system to see how its behaving. As you can see, Istio has
instrumented our transactions automatically just by using their
framework. Its using the Prometheus metrics collection engine, but they
set it up for you out of the box. We can visualize the metrics using
Grafana. Using the helm chart in this article, accessing the endpoint of
the Grafana pod will require setting up a local kubectl port forward
rule:

export POD_NAME=$(kubectl get pods –namespace default -l “component=istio-istio-grafana” -o jsonpath=”{.items[0].metadata.name}”)

kubectl port-forward $POD_NAME 3000:3000 –namespace default

You can then access Grafana at:
http://127.0.0.1:3000/dashboard/db/istio-dashboard
The Grafana Dashboard with the included Istio template that highlights
useful metrics Have you developed something cool with Istio
on Rancher? If so, we’d love to hear about it. Feel free to drop us a
line on twitter @Rancher_Labs, or
on our user slack.

Source

Deploying Rancher from the AWS Marketplace


A Detailed Overview of Rancher’s Architecture

This newly-updated, in-depth guidebook provides a detailed overview of the features and functionality of the new Rancher: an open-source enterprise Kubernetes platform.

Get the eBook

A step-by-step guide

Rancher is now available for easy deployment from the Amazon Web
Services (AWS)
Marketplace
.
While Rancher has always been easy to install, availability in the
marketplace makes installing Rancher faster and easier than ever. In
the article below, I provide a step-by-step guide to deploying a working
Rancher environment on AWS. The process involves two distinct parts:

  • In part I I step through the process of installing a Rancher
    management node from the AWS Marketplace
  • In **part II **I deploy a Kubernetes cluster in AWS using the
    Rancher management node deployed in part I

From my own experience, it is often small details missed that can lead
to trouble. In this guide I attempt to point out some potential pitfalls
to help ensure a smooth installation.

Before you get started

If you’re a regular AWS user you’ll find this process straightforward.
Before you get started you’ll need:

  • An Amazon EC2 account – If you don’t already have an account,
    you can visit AWS EC2 (https://aws.amazon.com/ec2/) and select
    Get started with Amazon EC2 and follow the process there to
    create a new account.
  • An AWS Keypair – If you’re not familiar with Key Pairs, you can
    save yourself a little grief by familiarizing yourself with the
    topic. You’ll need a Key Pair to connect via ssh to the machine you
    create on AWS. Although most users will probably never have a need
    to ssh to the management host, the installation process still
    requires that a Key Pair exist. From within the Network & Security
    heading in your AWS account select Key Pairs. You can create a Key
    Pair, give it a name, and the AWS console will download a PEM file
    (a ASCII vase64 X.509 certificate) that you should keep on your
    local machine. This will hold the RSA Private Key that you’ll need
    to access the machine via ssh or scp. It’s important that you
    save the key file, because if you lose it, it can’t be replaced and
    you’ll need to create a new one. The marketplace installation
    process for Rancher will assume you already have a Key Pair file.
    You can more read about Key Pairs in the AWS on-line
    documentation
    .
  • Setup AWS Identity and Access Management – If you’re new to
    AWS, this will seem a little tedious, but you’ll want to create an
    IAM users account at some point through the AWS console. You don’t
    need to do this to install Rancher from the AWS Marketplace, but
    you’ll need these credentials to use the Cloud Installer to add
    extra hosts to your Rancher cluster as described in part II of this
    article. You can follow the instructions to Create your Identity
    and Access Management
    Credentials
    .

With these setup items out of the way, we’re ready to get started.

Step 1: Select a Rancher offering from the marketplace

There are three different offerings in the Marketplace as shown below.

  • Rancher on
    RancherOS

    – This is the option we’ll use in this example. This is a single
    container implementation of the Rancher environment running on
    RancherOS, a lightweight Linux optimized for container environments
  • RancherOS –
    HVM

    This marketplace offering installs the RancherOS micro Linux
    distribution only without the Rancher environment. You might use
    this as the basis to package your own containerized application on
    RancherOS. HVM refers to the type of Linux AMI used – you can
    learn more about Linux AMI Virtualization Types
    here
    .
  • RancherOS – HVM – ECS
    Enabled

    – This marketplace offering is a variant of the RancherOS offering
    above intended for use with Amazon’s EC2 Container Service
    (ECS)
    .

We’ll select the first option – Rancher on RancherOS:
** **
After you select Rancher on RancherOS you’ll see additional
informational including pricing details. There is no charge for the use
of the software itself, but you’ll be charged for machine hours and
other fees like EBS magnetic volumes and data transfer at standard AWS
rates. Press Continue once you’ve reviewed the details and the
pricing.

** ** Step2: Select an installation type and provide installation
details The next step is to select an installation method and provide
required settings that AWS will need to provision your machine running
Rancher. There are three installation types:

  1. Click Launch – this is the fastest and easiest approach. Our
    example below assumes this method of installation.
  2. Manual Launch – this installation method will guide you through
    the process of installing Rancher OS using the EC2 Console, API
    or CLI.
  3. Service Catalog – you can also copy versions of Rancher on
    RancherOS to a Service Catalog specific to a region and assign users
    and roles. You can learn more about AWS Service Catalogs
    here.

Select Click Launch and provides installation options as shown:

  • Version – select a version of Rancher to install. By default
    the latest is selected.
  • Region – select the AWS region where you will deploy the
    software. You’ll want to make a note of this because the AWS EC2
    dashboard segments machines by Region (pull-down at the top right of
    the AWS EC2 dashboard). You will need to have the correct region
    selected to see your machines. Also, as you add additional Rancher
    hosts, you’ll want to install them in the same Region, Availability
    Group and Subnet as the management host.
  • EC2 Instance Type – t2.medium is the default (a machine with 4GB
    of RAM and 2 virtual cores). This is inexpensive and OK for
    testing, but you’ll want to use larger machines to actually run
    workloads.
  • VPC Settings (Virtual Private Cloud) – You can specify a
    virtual private cloud and subnet or create your own. Accept the
    default here unless you have reason to select a particular cloud.
  • Security Group – If you have an appropriate Security Group
    already setup in the AWS console you can specify it here. Otherwise
    the installer will create one for you that ensures needed ports are
    open including port 22 (to allow ssh access to the host) and port
    8080 (where the Rancher UI will be exposed).
  • Key Pair – As mentioned at the outset, select a previously
    created Key Pair for which you’ve already saved the private key (the
    X.509 PEM file). You will need this file in case you need to connect
    to your provisioned VM using ssh or scp. To connect using ssh you
    would use a command like this: ssh -i key-pair-name.pem
    <public-ip-address>

When you’ve entered these values select “Launch with 1-click“

Once you launch Rancher,you’ll see the screen below confirming details
of your installation. You’ll receive an e-mail as well. This will
provide you with convenient links to:

  • Your EC2 console – that you can visit anytime by visiting
    http://aws.amazon.com/ec2
  • Your Software page, that provides information about your various
    AWS Marketplace subscriptions

Step 3: Watch as the machine is provisioned

From this point on, Rancher should install by itself. You can monitor
progress by visiting the AWS EC2 Console. Visit
http://aws.amazon.com, login with your AWS credentials, and select EC2
under AWS services. You should see the new AWS t2.medium machine
instance initializing as shown below. Note the pull-down in the top
right of “North Virginia”. This provides us with visibility to machines
in the US East region selected in the previous step.

Step 4: Connect to the Rancher UI

The Rancher machine will take a few minutes to provision, but once
complete, you should be able to connect to the external IP address for
the host (shown in the EC2 console above) on port 8080. Your IP address
will be different but in our case the Public IP address was
54.174.92.13, so we pointed a browser to the URL
http://54.174.92.13:8080. It may take a few minutes for Rancher UI to
become available but you should see the screen below.

Congratulations! If you’ve gotten this far you’ve successfully
deployed Rancher in the AWS cloud! ** **

Having the Rancher UI up and running is nice, but there’s not a lot you
can do with Rancher until you have cluster nodes up and running. In
this section I’ll look at how to deploy a Kubernetes cluster using the
Rancher management node that I deployed from the marketplace in Part I.

Step 1 – Setting up Access Control

You’ll notice when the Rancher UI is first provisioned, there is no
access control. This means that anyone can connect to the web
interface. You’ll be prompted with a warning indicating that you should
setup Authentication before proceeding. Select Access Control under
the ADMIN menu in the Rancher UI. Rancher exposes multiple
authentication options as shown including the use of external Access
Control providers. DevOps teams will often store their projects in a
GitHub repository, so using GitHub for authentication is a popular
choice. We’ll use GitHub in this example. For details on using other
Access Control methods, you can consult the Rancher
Documentation
.

GitHub users should follow the directions, and click on the link
provided in the Rancher UI to setup an OAuth application in GitHub.
You’ll be prompted to provide your GitHub credentials. Once logged into
GitHub, you should see a screen listing any OAuth applications and
inviting you to Register a new application. We’re going to setup
Rancher for Authentication with Git Hub.

Click the Register a new application button in Git Hub, and
provide details about your Rancher installation on AWS. You’ll need the
Public IP address or fully qualified host name for your Rancher
management host.

Once you’ve supplied details about the Rancher application to Git Hub
and clicked Register application, Git Hub will provide you with a
Client ID and a Client Secret for the Rancher application as
shown below.

Copy and paste the Client ID and the Client Secret that appears in Git
Hub into the Rancher Access Control setup screen, and save these values.

Once these values are saved, click Authorize to allow Git Hub
authentication to be used with your Rancher instance.

If you’ve completed these steps successfully, you should see a message
that Git Hub authentication has been setup. You can invite additional
Git Hub users or organizations to access your Rancher instance as shown
below.

Step 2 – Add a new Rancher environment

When Rancher is deployed, there is a single Default environment that
uses Rancher’s native orchestration engine called Cattle. Since
we’re going to install a Rancher managed Kubernetes cluster, we’ll need
to add a new environment for Kubernetes. Under the environment selection
menu on the left labelled Default, select Add Environment.
Provide a name and description for the environment as shown, and select
Kubernetes as the environment template. Selecting the Kubernetes
framework means that Kubernetes will be used for Orchestration, and
additional Rancher frameworks will be used including Network Services,
Healthcheck Services and Rancher IPsec as the software-defined network
environment in Kubernetes.

Once you add the new environment, Rancher will immediately begin trying
to setup a Kubernetes environment. Before Rancher can proceed however a
Docker host needs to be added.

Step 3 – Adding Kubernetes cluster hosts

To add a host in Rancher, click on Add a host on the warning message
that appears at the top of the screen or select the Add Host option
under the Infrastructure -> Hosts menu. Rancher provides multiple
ways to add hosts. You can add an existing Docker host on-premises or in
the cloud, or you can automatically add hosts using a cloud-provider
specific machine driver as shown below. Since our Rancher management
host is running on Amazon EC2, we’ll select the Amazon EC2 machine
driver to auto-provision additional cluster hosts. You’ll want to select
the same AWS region where your Rancher management host resides and
you’ll need your AWS provided Access key and Secret key. If you
don’t have an AWS Access key and Secret key, the AWS
documentation

explains how you can obtain one. You’ll need to provide your AWS
credentials to Rancher as shown so that it can provision machines on
your behalf.

After you’ve provided your AWS credentials, select the AWS Virtual
private cloud and subnet. We’ve selected the same VPC where our Rancher
management node was installed from the AWS marketplace.

Security groups in AWS EC2 express a set of inbound and outbound
security rules. You can choose a security group already setup in your
AWS account, but it is easier to just let Rancher use the existing
rancher-machine group to ensure the network ports that Rancher needs
open are configured appropriately.

After setting up the security group, you can set your instance options
for the additional cluster nodes. You can add multiple hosts at a time.
We add five hosts in this example. We can give the hosts a name. We use
k8shost as our prefix, and Rancher will append a number to the
prefix naming our hosts k8shost1 through k8shost5. You can
select the type of AWS host you’d like for your Kubernetes cluster. For
testing, a t2.medium instance is adequate (2 cores and 4GB of RAM)
however if you are running real workloads, a larger node would be
better. Accept the default 16GB root directory size. If you leave the
AMI blank, Rancher will provision the machine using an Ubuntu AMI. Note
that the ssh username will be ubuntu for this machine type. You
can leave the other settings alone in case you want to change the
defaults.

Once you click Create, Rancher will use your AWS credentials to
provision the hosts using your selected options in your AWS cloud
account. You can monitor the creation of the new hosts from the EC2
dashboard as shown.

Progress will also be shown from within Rancher. Rancher will
automatically provision the AWS host, install the appropriate version of
Docker on the host, provide credentials, start a rancher Agent, and once
the agent is present Rancher will orchestrate the installation of
Kubernetes pulling the appropriate rancher components from the Docker
registry to each cluster host.
You can also monitor the step-by-step provisioning process by
selecting Hosts as shown below under the Infrastructure menu.
This view shows our five node Kubernetes cluster at different stages of
provisioning.

It will take a few minutes before the environment is provisioned and up
and running, but when the dust settles, the Infrastructure Stacks
view should show that the Rancher stacks comprising the Kubernetes
environment are all up and running and healthy.

Under the Kubernetes pull-down, you can launch a Kubernetes shell and
issue kubectl commands. Remember that Kubernetes has the notion of
namespaces, so to see the Pods and Services used by Kubernetes itself,
you’ll need to query the kube-system namespace. This same screen also
provides guidance for installing the kubectl CLI on your own local host.

Rancher also provides access to the Kubernetes Dashboard following the
automated installation under the Kubernetes pull-down.

Congratulations! If you’ve gotten this far, give yourself a pat on the
back. You’re now a Rancher on AWS expert!

Source

Docker at DEVIntersection 2018 – Docker Blog

Docker will be at DEVIntersection 2018 in Las Vegas the first week in December. DEVIntersection now in its fifth year, brings Microsoft leaders, engineers and industry experts together to educate, network, and share their expertise with developers. This year DEVIntersection will have a Developer, SQL Server and AI/Azure tracks integrated into a single event. Docker be featured at DEVIntersection via the following sessions:

Modernizing .NET Applications with Docker on Azure

Derrick Miller, a Docker Senior Solutions Engineer, will deliver a session focused on using containers as a modernization path for traditional applications, including how to select Windows Server 2008 applications for containerization, implementation tips, and common gotchas.

Depend on Docker – Get It Done with Docker on Azure

Alex Iankoulski, a Docker Captain, will highlight how how Baker Hughes, a GE Company, uses Docker to transform software development and delivery. Be inspired by the story of software professionals and scientists who were enabled by Docker to use a common language and work together to create a sophisticated platform for the Oil & Gas Industry. Attendees will see practical examples of how Docker is deployed on Azure.

Docker for Web Developers

Dan Wahlin, a Microsoft MVP and Docker Captain, will focus on the fundamentals of Docker and update attendees about the tools that can be used to get a full dev environment up and running locally with minimal effort. Attendees will also learn how to create Docker images that can be moved between different environments.

You can learn when the sessions are being delivered here.

Can’t make it the conference? Learn how Docker Enterprise is helping customers reduce their hardware and software licensing costs by up to 50% and enabling them to migrate their legacy Windows applications here.

Don’t miss #CodeParty at DevIntersection and Microsoft Connect();

On Tuesday, Dec. 4 after DEVIntersection and starting at 5:30PM PST Docker will join @Mobilize, @LEADTOOLS, @PreEmptive, @DocuSignAPI, @CData and @Twilio to kick off another hilarious and prize-filled stream of geek weirdness and trivia questions on the CodeParty twitch channel. You won’t want to miss it, because the only way to get some high-quality swag is to answer the trivia questions on the Twitch chat stream. We’ll be giving away a couple of Surface Go laptops, gift certificates to Amazon, an Xbox and a bunch of other cool stuff. Don’t miss it!

Learn more about the partners participating together with Docker at #CodeParty:

Mobilize.net

Mobilize.Net’s AI-driven code migration tools reduce the cost and time to modernize valuable legacy client-server applications. Convert VB6 code to .NET or even a modern web application. Move PowerBuilder to Angular and ASP.NET Core or Java Spring. Automated migration tools cut time, cost, and risk from legacy modernization projects.

Progress
The creator of Telerik .NET and Kendo UI JavaScript user interface components/controls, reporting solutions and productivity tools, Progress offers all the tools developers need to build high-performance modern web, mobile, and desktop apps with outstanding UI including modern chatbot experiences.
LEADTOOLS

LEADTOOLS Imaging SDKs help programmers integrate A-Z imaging into their cross-platform applications with a comprehensive toolkits offer powerful features including OCR, Barcode, Forms, PDF, Document Viewing, Image Processing, DICOM, and PACS for building an Enterprise Content Management (ECM) solution, zero-footprint medical viewer, or audio/video media streaming server.

PreEmptive Solutions

PreEmptive Solutions provides quick to implement, application protection to hinder IP and data attacks and improve security related compliance. P PreEmptive’s application shielding and .NET, Xamarin, Java and Android obfuscator solutions help protect your assets now – whether client, server, cloud or mobile app protection.

DocuSign

Whether you are looking for a simple eSignature integration or building a complex workflow, the DocuSign APIs and tools have you covered. Our new C# SDK includes .NET Core 2.0 support, and a new Quick Start API code example for C#, complete with installation and demonstration video. s Open source SDKs also available for PHP, Java, Ruby, Python, and Node.js.

CData

CData Software is a leading provider of Drivers & Adapters for data integration offering real-time SQL-92 connectivity to more than 100+ SaaS, NoSQL, and Big Data sources, through established standards like ODBC, JDBC, ADO.NET, and ODATA. By virtualizing data access, the CData drivers insulate developers from the complexities of data integration while enabling real-time data access from major BI, ETL and reporting tools.

Twilio

Twilio powers the future of business communications. Enabling phones, VoIP, and messaging to be embedded into web, desktop, and mobile software. We take care of the messy telecom hardware and expose a globally available cloud API that developers can interact with to build intelligent and complex communications systems that scales with you.

Source

Managing containerized system services with Podman

Managing containerized system services with Podman

In this article, I discuss containers, but look at them from another angle. We usually refer to containers as the best technology for developing new cloud-native applications and orchestrating them with something like Kubernetes. Looking back at the origins of containers, we’ve mostly forgotten that containers were born for simplifying application distribution on standalone systems.

In this article, we’ll talk about the use of containers as the perfect medium for installing applications and services on a Red Hat Enterprise Linux (RHEL) system. Using containers doesn’t have to be complicated, I’ll show how to run MariaDB, Apache HTTPD, and WordPress in containers, while managing those containers like any other service, through systemd and systemctl.

Additionally, we’ll explore Podman, which Red Hat has developed jointly with the Fedora community. If you don’t know what Podman is yet, see my previous article, Intro to Podman (Red Hat Enterprise Linux 7.6) and Tom Sweeney’s Containers without daemons: Podman and Buildah available in RHEL 7.6 and RHEL 8 Beta.

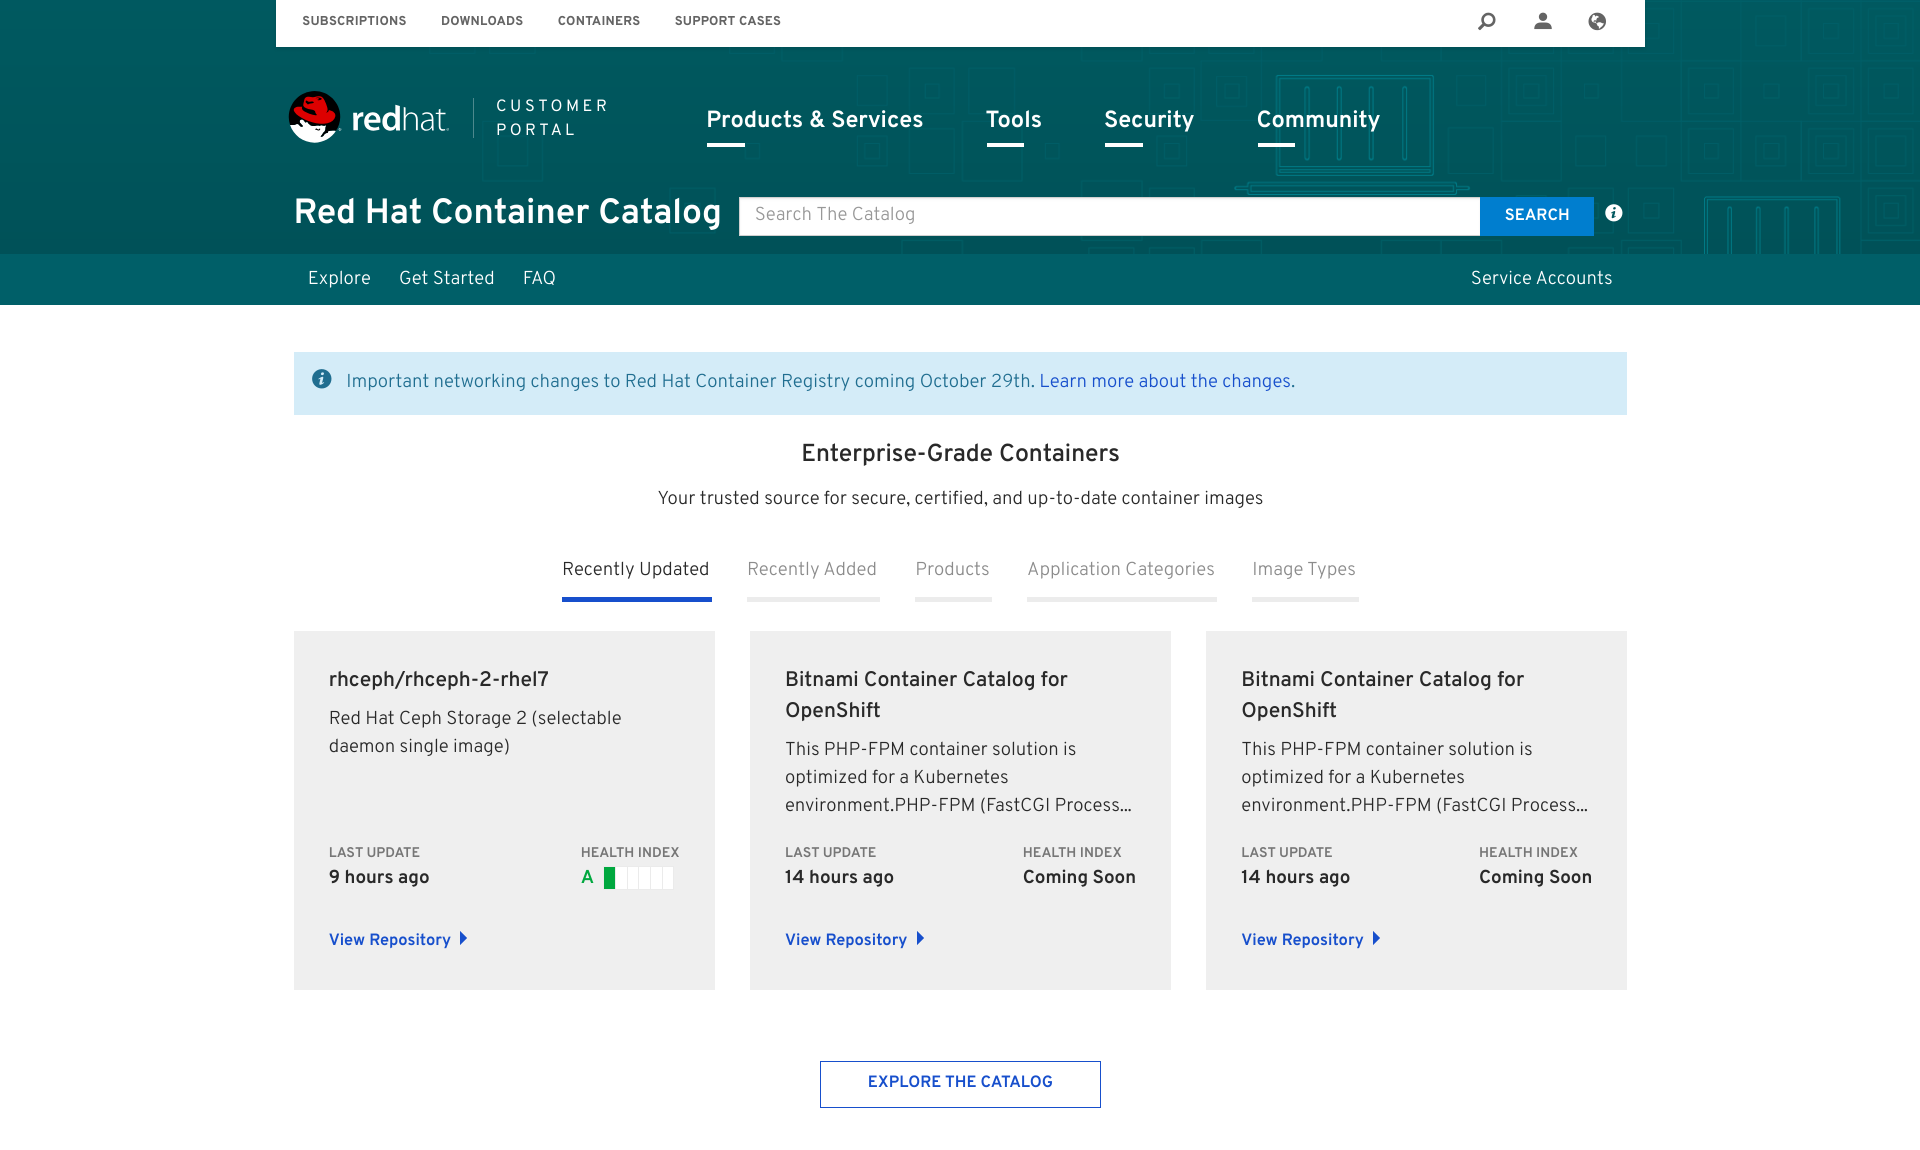
Red Hat Container Catalog

First of all, let’s explore the containers that are available for Red Hat Enterprise Linux through the Red Hat Container Catalog (access.redhat.com/containers):

By clicking Explore The Catalog, we’ll have access to the full list of containers categories and products available in Red Hat Container Catalog.

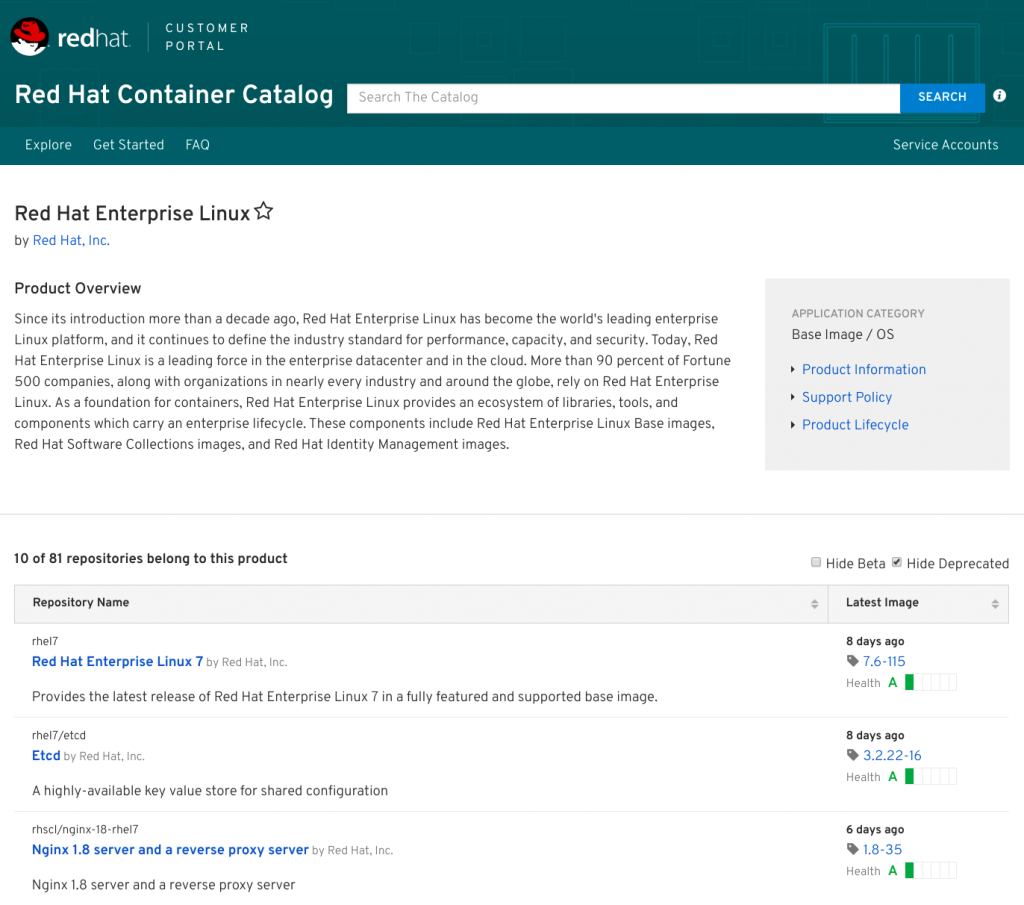
Exploring the available containers

Clicking Red Hat Enterprise Linux will bring us to the RHEL section, displaying all the available containers images for the system:

Available RHEL containers

At the time of writing this article, in the RHEL category there were more than 70 containers images, ready to be installed and used on RHEL 7 systems.

So let’s choose some container images and try them on a Red Hat Enterprise Linux 7.6 system. For demo purposes, we’ll try to use Apache HTTPD + PHP and the MariaDB database for a WordPress blog.

Install a containerized service

We’ll start by installing our first containerized service for setting up a MariaDB database that we’ll need for hosting the WordPress blog’s data.

As a prerequisite for installing containerized system services, we need to install the utility named Podman on our Red Hat Enterprise Linux 7 system:

[root@localhost ~]# subscription-manager repos –enable rhel-7-server-rpms –enable rhel-7-server-extras-rpms
[root@localhost ~]# yum install podman

As explained in my previous article, Podman complements Buildah and Skopeo by offering an experience similar to the Docker command line: allowing users to run standalone (non-orchestrated) containers. And Podman doesn’t require a daemon to run containers and pods, so we can easily say goodbye to big fat daemons.

By installing Podman, you’ll see that Docker is no longer a required dependency!

As suggested by the Red Hat Container Catalog’s MariaDB page, we can run the following commands to get the things done (we’ll replace, of course, docker with podman):

[root@localhost ~]# podman pull registry.access.redhat.com/rhscl/mariadb-102-rhel7
Trying to pull registry.access.redhat.com/rhscl/mariadb-102-rhel7…Getting image source signatures
Copying blob sha256:9a1bea865f798d0e4f2359bd39ec69110369e3a1131aba6eb3cbf48707fdf92d
72.21 MB / 72.21 MB [======================================================] 9s
Copying blob sha256:602125c154e3e132db63d8e6479c5c93a64cbfd3a5ced509de73891ff7102643
1.21 KB / 1.21 KB [========================================================] 0s
Copying blob sha256:587a812f9444e67d0ca2750117dbff4c97dd83a07e6c8c0eb33b3b0b7487773f
6.47 MB / 6.47 MB [========================================================] 0s
Copying blob sha256:5756ac03faa5b5fb0ba7cc917cdb2db739922710f885916d32b2964223ce8268
58.82 MB / 58.82 MB [======================================================] 7s
Copying config sha256:346b261383972de6563d4140fb11e81c767e74ac529f4d734b7b35149a83a081
6.77 KB / 6.77 KB [========================================================] 0s
Writing manifest to image destination
Storing signatures
346b261383972de6563d4140fb11e81c767e74ac529f4d734b7b35149a83a081

[root@localhost ~]# podman images
REPOSITORY TAG IMAGE ID CREATED SIZE
registry.access.redhat.com/rhscl/mariadb-102-rhel7 latest 346b26138397 2 weeks ago 449MB

After that, we can look at the Red Hat Container Catalog page for details on the needed variables for starting the MariaDB container image.

Inspecting the previous page, we can see that under Labels, there is a label named usage containing an example string for running this container image:

usage docker run -d -e MYSQL_USER=user -e MYSQL_PASSWORD=pass -e MYSQL_DATABASE=db -p 3306:3306 rhscl/mariadb-102-rhel7

After that we need some other information about our container image: the “user ID running inside the container” and the “persistent volume location to attach“:

[root@localhost ~]# podman inspect registry.access.redhat.com/rhscl/mariadb-102-rhel7 | grep User
“User”: “27”,
[root@localhost ~]# podman inspect registry.access.redhat.com/rhscl/mariadb-102-rhel7 | grep -A1 Volume
“Volumes”: {
/var/lib/mysql/data“: {}
[root@localhost ~]# podman inspect registry.access.redhat.com/rhscl/mariadb-102-rhel7 | grep -A1 ExposedPorts
“ExposedPorts”: {
3306/tcp”: {}

At this point, we have to create the directories that will handle the container’s data; remember that containers are ephemeral by default. Then we set also the right permissions:

[root@localhost ~]# mkdir -p /opt/var/lib/mysql/data
[root@localhost ~]# chown 27:27 /opt/var/lib/mysql/data

Then we can set up our systemd unit file for handling the database. We’ll use a unit file similar to the one prepared in the previous article:

[root@localhost ~]# cat /etc/systemd/system/mariadb-service.service
[Unit]
Description=Custom MariaDB Podman Container
After=network.target

[Service]
Type=simple
TimeoutStartSec=5m
ExecStartPre=-/usr/bin/podman rm “mariadb-service”

ExecStart=/usr/bin/podman run –name mariadb-service -v /opt/var/lib/mysql/data:/var/lib/mysql/data:Z -e MYSQL_USER=wordpress -e MYSQL_PASSWORD=mysecret -e MYSQL_DATABASE=wordpress –net host registry.access.redhat.com/rhscl/mariadb-102-rhel7

ExecReload=-/usr/bin/podman stop “mariadb-service”
ExecReload=-/usr/bin/podman rm “mariadb-service”
ExecStop=-/usr/bin/podman stop “mariadb-service”
Restart=always
RestartSec=30

[Install]
WantedBy=multi-user.target

Let’s take apart our ExecStart command and analyze how it’s built:

  • /usr/bin/podman run –name mariadb-service says we want to run a container that will be named mariadb-service.
  • v /opt/var/lib/mysql/data:/var/lib/mysql/data:Z says we want to map the just-created data directory to the one inside the container. The Z option informs Podman to map correctly the SELinux context for avoiding permissions issues.
  • e MYSQL_USER=wordpress -e MYSQL_PASSWORD=mysecret -e MYSQL_DATABASE=wordpress identifies the additional environment variables to use with our MariaDB container. We’re defining the username, the password, and the database name to use.
  • –net host maps the container’s network to the RHEL host.
  • registry.access.redhat.com/rhscl/mariadb-102-rhel7 specifies the container image to use.

We can now reload the systemd catalog and start the service:

[root@localhost ~]# systemctl daemon-reload
[root@localhost ~]# systemctl start mariadb-service
[root@localhost ~]# systemctl status mariadb-service
mariadb-service.service – Custom MariaDB Podman Container
Loaded: loaded (/etc/systemd/system/mariadb-service.service; static; vendor preset: disabled)
Active: active (running) since Thu 2018-11-08 10:47:07 EST; 22s ago
Process: 16436 ExecStartPre=/usr/bin/podman rm mariadb-service ​(code=exited, status=0/SUCCESS)
Main PID: 16452 (podman)
CGroup: /system.slice/mariadb-service.service
└─16452 /usr/bin/podman run –name mariadb-service -v /opt/var/lib/mysql/data:/var/lib/mysql/data:Z -e MYSQL_USER=wordpress -e MYSQL_PASSWORD=mysecret -e MYSQL_DATABASE=wordpress –net host regist…

Nov 08 10:47:14 localhost.localdomain podman[16452]: 2018-11-08 15:47:14 140276291061504 [Note] InnoDB: Buffer pool(s) load completed at 181108 15:47:14
Nov 08 10:47:14 localhost.localdomain podman[16452]: 2018-11-08 15:47:14 140277156538560 [Note] Plugin ‘FEEDBACK’ is disabled.
Nov 08 10:47:14 localhost.localdomain podman[16452]: 2018-11-08 15:47:14 140277156538560 [Note] Server socket created on IP: ‘::’.
Nov 08 10:47:14 localhost.localdomain podman[16452]: 2018-11-08 15:47:14 140277156538560 [Warning] ‘user’ entry ‘root@b75779533f08’ ignored in –skip-name-resolve mode.
Nov 08 10:47:14 localhost.localdomain podman[16452]: 2018-11-08 15:47:14 140277156538560 [Warning] ‘user’ entry ‘@b75779533f08’ ignored in –skip-name-resolve mode.
Nov 08 10:47:14 localhost.localdomain podman[16452]: 2018-11-08 15:47:14 140277156538560 [Warning] ‘proxies_priv’ entry ‘@% root@b75779533f08’ ignored in –skip-name-resolve mode.
Nov 08 10:47:14 localhost.localdomain podman[16452]: 2018-11-08 15:47:14 140277156538560 [Note] Reading of all Master_info entries succeded
Nov 08 10:47:14 localhost.localdomain podman[16452]: 2018-11-08 15:47:14 140277156538560 [Note] Added new Master_info ” to hash table
Nov 08 10:47:14 localhost.localdomain podman[16452]: 2018-11-08 15:47:14 140277156538560 [Note] /opt/rh/rh-mariadb102/root/usr/libexec/mysqld: ready for connections.
Nov 08 10:47:14 localhost.localdomain podman[16452]: Version: ‘10.2.8-MariaDB’ socket: ‘/var/lib/mysql/mysql.sock’ port: 3306 MariaDB Server

Perfect! MariaDB is running, so we can now start working on the Apache HTTPD + PHP container for our WordPress service.

First of all, let’s pull the right container from Red Hat Container Catalog:

[root@localhost ~]# podman pull registry.access.redhat.com/rhscl/php-71-rhel7
Trying to pull registry.access.redhat.com/rhscl/php-71-rhel7…Getting image source signatures
Skipping fetch of repeat blob sha256:9a1bea865f798d0e4f2359bd39ec69110369e3a1131aba6eb3cbf48707fdf92d
Skipping fetch of repeat blob sha256:602125c154e3e132db63d8e6479c5c93a64cbfd3a5ced509de73891ff7102643
Skipping fetch of repeat blob sha256:587a812f9444e67d0ca2750117dbff4c97dd83a07e6c8c0eb33b3b0b7487773f
Copying blob sha256:12829a4d5978f41e39c006c78f2ecfcd91011f55d7d8c9db223f9459db817e48
82.37 MB / 82.37 MB [=====================================================] 36s
Copying blob sha256:14726f0abe4534facebbfd6e3008e1405238e096b6f5ffd97b25f7574f472b0a
43.48 MB / 43.48 MB [======================================================] 5s
Copying config sha256:b3deb14c8f29008f6266a2754d04cea5892ccbe5ff77bdca07f285cd24e6e91b
9.11 KB / 9.11 KB [========================================================] 0s
Writing manifest to image destination
Storing signatures
b3deb14c8f29008f6266a2754d04cea5892ccbe5ff77bdca07f285cd24e6e91b

We can now look through this container image to get some details:

[root@localhost ~]# podman inspect registry.access.redhat.com/rhscl/php-71-rhel7 | grep User
“User”: “1001”,
“User”: “1001”
[root@localhost ~]# podman inspect registry.access.redhat.com/rhscl/php-71-rhel7 | grep -A1 Volume
[root@localhost ~]# podman inspect registry.access.redhat.com/rhscl/php-71-rhel7 | grep -A1 ExposedPorts
“ExposedPorts”: {
“8080/tcp”: {},

As you can see from the previous commands, we got no volume from the container details. Are you asking why? It’s because this container image, even if it’s part of RHSCL (formerly known as Red Hat Software Collections), has been prepared for working with the Source-to-Image (S2I) builder. For more info on the S2I builder, please take a look at its GitHub project page.

Unfortunately, at this moment, the S2I utility is strictly dependent on Docker, but for demo purposes, we would like to avoid it..!

So moving back to our issue, what can we do for guessing the right folder to mount on our PHP container? We can easily guess the right location by looking at all the environment variables for the container image, where we will find APP_DATA=/opt/app-root/src.

So let’s create this directory with the right permissions; we’ll also download the latest package for our WordPress service:

[root@localhost ~]# mkdir -p /opt/app-root/src/
[root@localhost ~]# curl -o latest.tar.gz https://wordpress.org/latest.tar.gz
[root@localhost ~]# tar -vxf latest.tar.gz
[root@localhost ~]# mv wordpress/* /opt/app-root/src/
[root@localhost ~]# chown 1001 -R /opt/app-root/src

We’re now ready for creating our Apache http + PHP systemd unit file:

[root@localhost ~]# cat /etc/systemd/system/httpdphp-service.service
[Unit]
Description=Custom httpd + php Podman Container
After=mariadb-service.service

[Service]
Type=simple
TimeoutStartSec=30s
ExecStartPre=-/usr/bin/podman rm “httpdphp-service”

ExecStart=/usr/bin/podman run –name httpdphp-service -p 8080:8080 -v /opt/app-root/src:/opt/app-root/src:Z registry.access.redhat.com/rhscl/php-71-rhel7 /bin/sh -c /usr/libexec/s2i/run

ExecReload=-/usr/bin/podman stop “httpdphp-service”
ExecReload=-/usr/bin/podman rm “httpdphp-service”
ExecStop=-/usr/bin/podman stop “httpdphp-service”
Restart=always
RestartSec=30

[Install]
WantedBy=multi-user.target

We need then to reload the systemd unit files and start our latest service:

[root@localhost ~]# systemctl daemon-reload

[root@localhost ~]# systemctl start httpdphp-service

[root@localhost ~]# systemctl status httpdphp-service
httpdphp-service.service – Custom httpd + php Podman Container
Loaded: loaded (/etc/systemd/system/httpdphp-service.service; static; vendor preset: disabled)
Active: active (running) since Thu 2018-11-08 12:14:19 EST; 4s ago
Process: 18897 ExecStartPre=/usr/bin/podman rm httpdphp-service (code=exited, status=125)
Main PID: 18913 (podman)
CGroup: /system.slice/httpdphp-service.service
└─18913 /usr/bin/podman run –name httpdphp-service -p 8080:8080 -v /opt/app-root/src:/opt/app-root/src:Z registry.access.redhat.com/rhscl/php-71-rhel7 /bin/sh -c /usr/libexec/s2i/run

Nov 08 12:14:20 localhost.localdomain podman[18913]: => sourcing 50-mpm-tuning.conf …
Nov 08 12:14:20 localhost.localdomain podman[18913]: => sourcing 40-ssl-certs.sh …
Nov 08 12:14:20 localhost.localdomain podman[18913]: AH00558: httpd: Could not reliably determine the server’s fully qualified domain name, using 10.88.0.12. Set the ‘ServerName’ directive globall… this message
Nov 08 12:14:20 localhost.localdomain podman[18913]: [Thu Nov 08 17:14:20.925637 2018] [ssl:warn] [pid 1] AH01909: 10.88.0.12:8443:0 server certificate does NOT include an ID which matches the server name
Nov 08 12:14:20 localhost.localdomain podman[18913]: AH00558: httpd: Could not reliably determine the server’s fully qualified domain name, using 10.88.0.12. Set the ‘ServerName’ directive globall… this message
Nov 08 12:14:21 localhost.localdomain podman[18913]: [Thu Nov 08 17:14:21.017164 2018] [ssl:warn] [pid 1] AH01909: 10.88.0.12:8443:0 server certificate does NOT include an ID which matches the server name
Nov 08 12:14:21 localhost.localdomain podman[18913]: [Thu Nov 08 17:14:21.017380 2018] [http2:warn] [pid 1] AH10034: The mpm module (prefork.c) is not supported by mod_http2. The mpm determines how things are …
Nov 08 12:14:21 localhost.localdomain podman[18913]: [Thu Nov 08 17:14:21.018506 2018] [lbmethod_heartbeat:notice] [pid 1] AH02282: No slotmem from mod_heartmonitor
Nov 08 12:14:21 localhost.localdomain podman[18913]: [Thu Nov 08 17:14:21.101823 2018] [mpm_prefork:notice] [pid 1] AH00163: Apache/2.4.27 (Red Hat) OpenSSL/1.0.1e-fips configured — resuming normal operations
Nov 08 12:14:21 localhost.localdomain podman[18913]: [Thu Nov 08 17:14:21.101849 2018] [core:notice] [pid 1] AH00094: Command line: ‘httpd -D FOREGROUND’
Hint: Some lines were ellipsized, use -l to show in full.

Let’s open the 8080 port on our system’s firewall for connecting to our brand new WordPress service:

[root@localhost ~]# firewall-cmd –permanent –add-port=8080/tcp
[root@localhost ~]# firewall-cmd –add-port=8080/tcp

We can surf to our Apache web server:

Apache web server

Start the installation process, and define all the needed details:

Start the installation process

And finally, run the installation!

Run the installation

At the end, we should reach out our brand new blog, running on Apache httpd + PHP backed by a great MariaDB database!
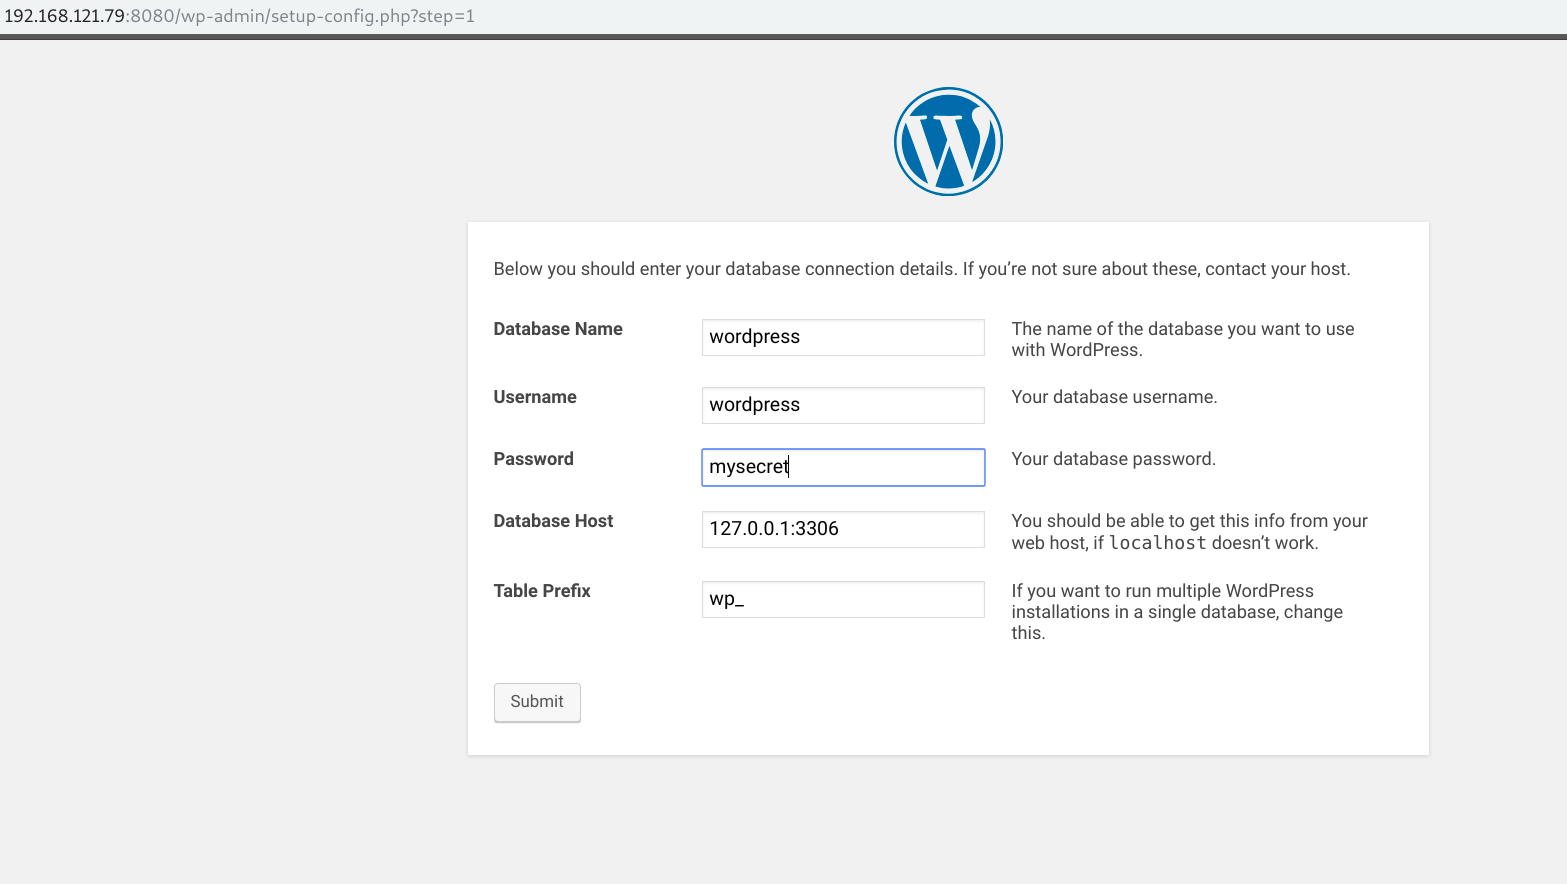
That’s all folks; may containers be with you!

Source

First Impressions: goto; Copenhagen

It’s November and that means conference season – people from all around the world are travelling to speak at, attend or organise tech conferences. This week I’ve been at my first goto; event in Copenhagen held at the Bella Sky Center in Denmark. I’ll write a bit about my experiences over the last few days.

We’re wondering if #gotoselfie will catch on?? Here with @ah3rz after doing a short interview to camera pic.twitter.com/w7ioMDL7DL

— Alex Ellis (@gotocph) (@alexellisuk) November 23, 2018

My connection to goto; was through my friend Adam Herzog who works for Trifork – the organisers of the goto events. I’ve known Adam since he was working at Docker in the community outreach and marketing team. One of the things I really like about his style is his live-tweeting from sessions. I’ve learnt a lot from him over the past few years so this post is going to feature Tweets and photos from the event to give you a first-person view of my week away.
First impressions CPH

Copenhagen has a great conference center and hotel connected by sky-bridge called Bella Sky. Since I live in the UK I flew in from London and the first thing I noticed in the airport was just how big it is! It feels like a 2km+/- walk from the Ryanair terminal to baggage collection. Since I was here last – they’ve added a Pret A Manger cafe that we’re used to seeing across the UK.
There’s a shuttle bus that leaves from Terminal 2 straight to the Bella Sky hotel. I was the only person on the bus and it was already almost dark at just 3pm in the afternoon.

On arrival the staff at the hotel were very welcoming and professional. The rooms are modern and clean with good views and facilities. I have stayed both at the Bella before and in the city. I liked the city for exploring during the evenings and free-time, but being close to the conference is great for convenience.

The conference days

This goto; event was three days long with two additional workshop days, so for some people it really is an action-packed week. The keynotes kick-off at 9am and are followed by talks throughout the day. The content at the keynotes was compelling, but at the same time wasn’t always focused on software development. For instance the opening session was called The future of high-speed transportation by rocket-scientist Anita Sengupta.

Unlike most conferences I’ve attended there were morning, afternoon and evening keynotes. This does make for quite long days, but also means the attendees are together most of the day rather than having to make their own plans.

One of my favourite keynote sessions was On the Road to Artificial General Intelligence by Danny Lange from Unity.

First we found out what AI was not:

‘These things are not AI’ @GOTOcph pic.twitter.com/7PJHH8qM5S

— Alex Ellis (@gotocph) (@alexellisuk) November 20, 2018

Then we saw AI in action – trained on GCP with TensorFlow to give a personality to the wireframe of a pet dog. That was then replicated into a race course with a behaviour that made the dog chase after a bone.

Fascinating – model of a dog trained by @unity3d to fetch bones. “all we used was TensorFlow and GCP, no developers programmed this” @GOTOcph pic.twitter.com/lOoiHsgCCx

— Alex Ellis (@gotocph) (@alexellisuk) November 20, 2018

My talk

On the first day I also gave my talk on Serverless Beyond the Hype.

There was an artist doing a live-sketch of my talk. I’ve seen this done a few times at meet-ups and I always find it fascinating to see how they capture the talk so well in pictures.

Awesome diagramming art by @MindsEyeCCF based the on @alexellisuk’s #GOTOcph talk on Serverless with @openfaas! pic.twitter.com/iXZawibeiQ

— Kenny Bastani (@kennybastani) November 19, 2018

My talk started off looking at Gartner’s Hype Cycle – explored ThoughtWorks’ opinions on multi-cloud and lock-in before covering RedMonk’s advice to adopt Kubernetes. After that I looked at the leading projects available that enable Serverless with Kubernetes and then gave some live demos and described case-studies of how various companies are leveraging OpenFaaS.

#serverless is going to get a bit worse before it gets better…@openfaas creator @alexellisuk sharing #gartner hype cycle predicting reaching plateau of productivity in 2-5 years and clickbait article on fear of lock-in from @TheRegister at #GOTOcph pic.twitter.com/gZmP7KsisP

— adam herzog (@ah3rz) November 19, 2018

Vision Bank is one of our production users who are benefiting from the automation, monitoring and self-healing, scaling infrastructure offered by containers.

cool #fintech #serverless case study using @openfaas in production @VisionBanco looking to skip #microservices and go from monolith to functions

#openfaas founder @alexellisuk at #GOTOcph pic.twitter.com/jALzmve5PH

— adam herzog (@ah3rz) November 19, 2018

And of course – no talk of mine is complete without live-demos:

Live coding session #GOTOcph @alexellisuk #openfaas pic.twitter.com/BOTGYkk4TD

— Nicolaj Lock (@mr_nlock) November 19, 2018

In my final demo the audience donated my personal money to a local children’s charity in Copenhagen using the Monzo bank API and OpenFaaS Cloud functions.

Serverless beyond the hype by @alexellisuk. Donating to @Bornecancerfond in the live demo 💰💸 #serverless pic.twitter.com/n1rzcqRByd

— Martin Jensen (@mrjensens) November 19, 2018

Feedback-loop

Later in the day Adam mentioned that my talk was well rated and that the recording would be made available in the goto play app. That means you can check it out any time.

Throughout the week I heard a lot about ratings and voting for sessions. The audience are able to give anonymous feedback to the speakers and the average rating given is taken seriously by the organisers. I’ve not seen such an emphasis put on feedback from attendees before and to start with it may seem off-putting, but I think getting feedback in this way can help speakers know their audience better. The audience seemed to be made up largely of enterprise developers and many had a background in Java development – a talk that would get a 5/5 rating at KubeCon may get a completely different rating here and visa-versa.

One of the tips I heard from the organisers was that speakers should clearly “set expectations” about their session in the first few minutes and in the abstract so that the audience are more likely to rate the session based upon the content delivered vs. the content they would have liked to have seen instead.

Hearing from RedMonk

I really enjoyed the talk by James Governer from RedMonk where James walked us through what he saw as trends in the industry relating to cloud, serverless and engineering practices. I set about live-tweeting the talk and you can find the start of the thread here:

James takes the stage @monkchips at @GOTOcph pic.twitter.com/qcQz0yUVUU

— Alex Ellis (@gotocph) (@alexellisuk) November 21, 2018

One of the salient points for me was where James suggested that the C-Level of tech companies have a harder time finding talent than capital. He then went on to talk about how developers are now the new “King Makers” for software. I’d recommend finding the recording when it becomes available on YouTube.

Hallway track

The hallway track basically means talking to people, ad-hoc meetings and the conversations you get to have because you’re physically at the event with like-minded people.

I met Kenny Bastani for the first time who’s a Field CTO at Pivotal and he asked me for a demo of OpenFaaS. Here it is – the Function Store that helps developers collaborate and share their functions with one another (in 42 seconds):

In 42 seconds @alexellisuk demos the most powerful feature of FaaS. The function store. This is what the future and the now looks like. An open source ecosystem of functions. pic.twitter.com/ix3ER4b7Jn

— Kenny Bastani (@kennybastani) 20 November 2018

Letting your hair down

My experience this week compared to some other large conferences showed that the Trifork team really know how to do things well. There were dozens of crew ready to help out, clear away and herd the 1600 attendees around to where they needed to be. This conference felt calm and relaxed depsite being packed with action and some very long days going on into the late evening.

Party time

We attended an all-attendee party on site where there was a “techno-rave” with DJ Sam Aaron from the SonicPi project. This is music generated by writing code and really well-known in the Raspberry Pi and maker community.

At the back of the room there was the chance to don a VR headset and enter another world – walking the plank off a sky-scraper or experiencing an under-water dive in a shark-cage.

VR and techno at the party @GOTOcph pic.twitter.com/3wfxS4vSeZ

— Alex Ellis (@gotocph) (@alexellisuk) November 20, 2018

Speakers’ dinner

I felt that the speakers were well looked after and the organisers helped with any technical issues that may have come up. The dinner organised for the Wednesday night was in an old theatre with Danish Christmas games and professional singers serenading us between courses. This was a good time to get to know other speakers really well and to have some fun.

Thank you @GOTOcph for the speakers’ dinner tonight. Very entertaining and great company! pic.twitter.com/LUfqf6zJRF

— Alex Ellis (@gotocph) (@alexellisuk) November 21, 2018

Workshop – Serverless OpenFaaS with Python

On Thursday after the three days of the conference talks we held a workshop called Serverless OpenFaaS with Python. My colleague Ivana Yocheva joined me from Sofia to help facilitate a workshop to a packed room of developers from varying backgrounds.

We had an awesome workshop yesterday at #GOTOcph with a packed room of developers learning how to build portable Serverless with Python and @openfaas #FaaSFriday pic.twitter.com/dhP9rN5wLa

— OpenFaaS (@openfaas) November 23, 2018

Feedback was very positive and I tried to make the day more engaging by introducing demos after we came back from lunch and the coffee breaks. We even introduced a little bit of competition to give away some t-shirts and beanies which went down well in the group.

Wrapping up

As I wrap up my post I want to say that I really enjoyed the experience and would highly recommend a visit to one of the goto conferences.

Despite only knowing around half a dozen people when I arrived, I made lots of new friends and contacts and am looking forward to keeping in touch and being part of the wider community. I’ll leave you with this really cute photo from Kasper Nissen the local CNCF Ambassador and community leader.

Thank you for the beanie, @alexellisuk! Definitely going to try out @openfaas in the coming weeks 🤓 pic.twitter.com/gSX63s9E6y

— 𝙺𝚊𝚜𝚙𝚎𝚛 𝙽𝚒𝚜𝚜𝚎𝚗 (@phennex) November 22, 2018

My next speaking session is at KubeCon North America in December speaking on Digital Transformation of Vision Banco Paraguay with Serverless Functions with Patricio Diaz.

Let’s meet up there for a coffee? Follow me on Twitter @alexellisuk

Get involved

Want to get involved in OpenFaaS or to contribute to Open Source?

Source