Kubernetes 1.14: Production-level support for Windows Nodes, Kubectl Updates, Persistent Local Volumes GA

  • We’re pleased to announce the delivery of Kubernetes 1.14, our first release of 2019!

    Kubernetes 1.14 consists of 31 enhancements: 10 moving to stable, 12 in beta, and 7 net new. The main themes of this release are extensibility and supporting more workloads on Kubernetes with three major features moving to general availability, and an important security feature moving to beta.

    More enhancements graduated to stable in this release than any prior Kubernetes release. This represents an important milestone for users and operators in terms of setting support expectations. In addition, there are notable Pod and RBAC enhancements in this release, which are discussed in the “additional notable features” section below.

    Let’s dive into the key features of this release:

    Production-level Support for Windows Nodes

    Up until now Windows Node support in Kubernetes has been in beta, allowing many users to experiment and see the value of Kubernetes for Windows containers. Kubernetes now officially supports adding Windows nodes as worker nodes and scheduling Windows containers, enabling a vast ecosystem of Windows applications to leverage the power of our platform. Enterprises with investments in Windows-based applications and Linux-based applications don’t have to look for separate orchestrators to manage their workloads, leading to increased operational efficiencies across their deployments, regardless of operating system.

    Some of the key features of enabling Windows containers in Kubernetes include:

    • Support for Windows Server 2019 for worker nodes and containers
    • Support for out of tree networking with Azure-CNI, OVN-Kubernetes, and Flannel
    • Improved support for pods, service types, workload controllers, and metrics/quotas to closely match the capabilities offered for Linux containers

    Notable Kubectl Updates

    New Kubectl Docs and Logo

    The documentation for kubectl has been rewritten from the ground up with a focus on managing Resources using declarative Resource Config. The documentation has been published as a standalone site with the format of a book, and it is linked from the main k8s.io documentation (available at https://kubectl.docs.kubernetes.io).

    The new kubectl logo and mascot (pronounced kubee-cuddle) are shown on the new docs site logo.

    Kustomize Integration

    The declarative Resource Config authoring capabilities of kustomize are now available in kubectl through the -k flag (e.g. for commands like apply, get) and the kustomize subcommand. Kustomize helps users author and reuse Resource Config using Kubernetes native concepts. Users can now apply directories with kustomization.yaml to a cluster using kubectl apply -k dir/. Users can also emit customized Resource Config to stdout without applying them via kubectl kustomize dir/. The new capabilities are documented in the new docs at https://kubectl.docs.kubernetes.io

    The kustomize subcommand will continue to be developed in the Kubernetes owned kustomize repo. The latest kustomize features will be available from a standalone kustomize binary (published to the kustomize repo) at a frequent release cadence, and will be updated in kubectl prior to each Kubernetes releases.

    kubectl Plugin Mechanism Graduating to Stable

    The kubectl plugin mechanism allows developers to publish their own custom kubectl subcommands in the form of standalone binaries. This may be used to extend kubectl with new higher-level functionality and with additional porcelain (e.g. adding a set-ns command).

    Plugins must have the kubectl- name prefix and exist on the user’s $PATH. The plugin mechanics have been simplified significantly for GA, and are similar to the git plugin system.

    Persistent Local Volumes are Now GA

    This feature, graduating to stable, makes locally attached storage available as a persistent volume source. Distributed file systems and databases are the primary use cases for persistent local storage due performance and cost. On cloud providers, local SSDs give better performance than remote disks. On bare metal, in addition to performance, local storage is typically cheaper and using it is a necessity to provision distributed file systems.

    PID Limiting is Moving to Beta

    Process IDs (PIDs) are a fundamental resource on Linux hosts. It is trivial to hit the task limit without hitting any other resource limits and cause instability to a host machine. Administrators require mechanisms to ensure that user pods cannot induce PID exhaustion that prevents host daemons (runtime, kubelet, etc) from running. In addition, it is important to ensure that PIDs are limited among pods in order to ensure they have limited impact to other workloads on the node.

    Administrators are able to provide pod-to-pod PID isolation by defaulting the number of PIDs per pod as a beta feature. In addition, administrators can enable node-to-pod PID isolation as an alpha feature by reserving a number of allocatable PIDs to user pods via node allocatable. The community hopes to graduate this feature to beta in the next release.

    Additional Notable Feature Updates

    Pod priority and preemption enables Kubernetes scheduler to schedule more important Pods first and when cluster is out of resources, it removes less important pods to create room for more important ones. The importance is specified by priority.

    Pod Readiness Gates introduce an extension point for external feedback on pod readiness.

    Harden the default RBAC discovery clusterrolebindings removes discovery from the set of APIs which allow for unauthenticated access by default, improving privacy for CRDs and the default security posture of default clusters in general.

    Availability

    Kubernetes 1.14 is available for download on GitHub. To get started with Kubernetes, check out these interactive tutorials. You can also easily install 1.14 using kubeadm.

    Features Blog Series

    If you’re interested in exploring these features more in depth, check back next week for our 5 Days of Kubernetes series where we’ll highlight detailed walkthroughs of the following features:

    • Day 1 – Windows Server Containers
    • Day 2 – Harden the default RBAC discovery clusterrolebindings
    • Day 3 – Pod Priority and Preemption in Kubernetes
    • Day 4 – PID Limiting
    • Day 5 – Persistent Local Volumes

    Release Team

    This release is made possible through the efforts of hundreds of individuals who contributed both technical and non-technical content. Special thanks to the release team led by Aaron Crickenberger, Senior Test Engineer at Google. The 43 individuals on the release team coordinated many aspects of the release, from documentation to testing, validation, and feature completeness.

    As the Kubernetes community has grown, our release process represents an amazing demonstration of collaboration in open source software development. Kubernetes continues to gain new users at a rapid clip. This growth creates a positive feedback cycle where more contributors commit code creating a more vibrant ecosystem. Kubernetes has had over 28,000 individual contributors to date and an active community of more than 57,000 people.

    Project Velocity

    The CNCF has continued refining DevStats, an ambitious project to visualize the myriad contributions that go into the project. K8s DevStats illustrates the breakdown of contributions from major company contributors, as well as an impressive set of preconfigured reports on everything from individual contributors to pull request lifecycle times. On average over the past year, 381 different companies and over 2,458 individuals contribute to Kubernetes each month. Check out DevStats to learn more about the overall velocity of the Kubernetes project and community.

    User Highlights

    Established, global organizations are using Kubernetes in production at massive scale. Recently published user stories from the community include:

    Is Kubernetes helping your team? Share your story with the community.

    Ecosystem Updates

KubeCon

The world’s largest Kubernetes gathering, KubeCon + CloudNativeCon is coming to Barcelona from May 20-23, 2019 and Shanghai (co-located with Open Source Summit) from June 24-26, 2019. These conferences will feature technical sessions, case studies, developer deep dives, salons, and more! Register today!

Webinar

Join members of the Kubernetes 1.14 release team on April 23rd at 10am PDT to learn about the major features in this release. Register here.

Get Involved

The simplest way to get involved with Kubernetes is by joining one of the many Special Interest Groups (SIGs) that align with your interests. Have something you’d like to broadcast to the Kubernetes community? Share your voice at our weekly community meeting, and through the channels below.

Thank you for your continued feedback and support.

Source

Advancing Windows Containers with Docker and Kubernetes

Today, the Cloud Native Computing Foundation (CNCF) announced Kubernetes 1.14, which includes support for Windows nodes. Kubernetes supporting Windows is a monumental step for the industry and it further confirms the work Docker has been doing with Microsoft to develop Windows containers over the past five years. It is evidence that containers are not just for Linux; Windows and .NET applications represent an important and sizeable footprint of applications that can benefit from both the Docker platform and Kubernetes.

Docker’s collaboration with Microsoft started five years ago. Today, every version of Windows Server 2016 and later ships with the Docker Engine – Enterprise. In addition, to facilitate a great user experience with Windows containers, Microsoft publishes more than 129 Windows container images of its popular software on Docker Hub. Many Docker Enterprise customers are already running mixed Windows and Linux containers with Swarm, and an upcoming release of Docker Enterprise will allow our customers to expand their Windows options to Kubernetes as well. Today both Docker Enterprise and Docker Desktop users have found that the easiest way to use and manage Kubernetes is with Docker and now these users will have the same benefits with Windows containers as well.

gMSA Support in Kubernetes for Active Directory-Authenticated Applications

In the time since that first Windows Server release, we’ve been working closely with customers to understand how to make containerized Windows applications enterprise-ready for production. Our five years of experience shows us that runtime support for Windows-based containers is only one component of what enterprises require to make Windows containers with Kubernetes operational in their environment.

An additional requirement is support for configuring containerized workloads with domain credentials and identity in an Active Directory environment. Initially we worked with Microsoft to plumb in gMSA credential support for individual containers running on Docker Engine in Windows. Next, we implemented orchestrator-wide support for gMSA credentials in Swarm. Using our experience so far, we are leading the design and implementation of gMSA support for Windows workloads in Kubernetes, delivering Alpha level support for gMSA support in Kubernetes 1.14.

Many Windows-based applications are run on domain joined hosts and use Service Accounts managed by Active Directory to access other resources and services in the domain. Windows containers, however, are not full-fledged domain joined objects. Instead, Windows containers can run with a special type of service account introduced in Windows Server 2012 called group managed service accounts (gMSA). Windows uses credentials associated with a gMSA (in lieu of individual computer accounts) to enable containerized Windows applications to access other services in an Active Directory domain.

Docker, in collaboration with Microsoft and the Kubernetes community, is working to add support for gMSA in Kubernetes. This encompasses: (1) custom resources to configure credential specs for gMSAs in a cluster wide fashion, (2) authorizing and resolving references to the gMSA credential specs from pod specifications and (3) passing down the full gMSA credential spec JSON to the container runtime (like Docker engine). This feature is in alpha with Kubernetes 1.14 and you can find more about its design and implementation here. We invite you to test this out and contribute to the effort which will help to further expand the types of applications that can be run in containers and will continue to work with the community on ensuring this reaches general availability.

Kubernetes and Windows: What’s Next

Windows admins and users also need overlay networking and dynamically provisioned storage to become enterprise-ready, and we are also working with the Kubernetes community in these areas and will have more to discuss and demonstrate at DockerCon 2019 in San Francisco. We look forward to sharing some of the progress here and hope to see you there!

To learn more about Docker and Windows containers:

Docker and Kubernetes, Docker and Windows Containers, dockercon, Kubernetes, Windows Containers and Kubernetes

Source

Grafana Logging using Loki

Grafana Logging using Loki

Loki is a Prometheus-inspired logging service for cloud native infrastructure.

What is Loki?

Open sourced by Grafana Labs during KubeCon Seattle 2018, Loki is a logging backend optimized for users running Prometheus and Kubernetes with great logs search and visualization in Grafana 6.0.

Loki was built for efficiency alongside the following goals:

  • Logs should be cheap. Nobody should be asked to log less.
  • Easy to operate and scale.
  • Metrics, logs (and traces later) need to work together.

Loki vs other logging solutions

As said, Loki is designed for efficiency to work well in the Kubernetes context in combination with Prometheus metrics.

The idea is to switch easily between metrics and logs based on Kubernetes labels you already use with Prometheus.

Unlike most logging solutions, Loki does not parse incoming logs or do full-text indexing.

Instead, it indexes and groups log streams using the same labels you’re already using with Prometheus. This makes it significantly more efficient to scale and operate.

Loki components

Loki is a TSDB (Time-series database), it stores logs as split and gzipped chunks of data.

The logs are ingested via the API and an agent, called Promtail (Tailing logs in Prometheus format), will scrape Kubernetes logs and add label metadata before sending it to Loki.

This metadata addition is exactly the same as Prometheus, so you will end up with the exact same labels for your resources.

https://grafana.com/blog/2018/12/12/loki-prometheus-inspired-open-source-logging-for-cloud-natives/

How to deploy Loki on your Kubernetes cluster

  1. Deploy Loki on your cluster

The easiest way to deploy Loki on your Kubernetes cluster is by using the Helm chart available in the official repository.

You can follow the setup guide from the official repo.

This will deploy Loki and Promtail.

  1. Add Loki datasource in Grafana (built-in support for Loki is in 6.0 and newer releases)
    1. Log into your Grafana.
    2. Go to Configuration > Data Sources via the cog icon in the left sidebar.
    3. Click the big + Add data source button.
    4. Choose Loki from the list.
    5. The http URL field should be the address of your Loki server: http://loki:3100
  2. See your logs in the “Explore” view
    1. Select the “Explore” view on the sidebar.
    2. Select the Loki data source.
    3. Choose a log stream using the “Log labels” button.

Promtail configuration

Promtail is the metadata appender and log sending agent

The Promtail configuration you get from the Helm chart is already configured to get all the logs from your Kubernetes cluster and append labels on it as Prometheus does for metrics.

However, you can tune the configuration for your needs.

Here are two examples:

  1. Get logs only for specific namespace

You can use the action: keep for your namespace and add a new relabel_configs for each scrape_config in promtail/configmap.yaml

For example, if you want to get logs only for the kube-system namespace:

scrape_configs:
– job_name: kubernetes-pods
kubernetes_sd_configs:
– role: pod
relabel_configs:
– source_labels: [__meta_kubernetes_namespace]
action: keep
regex: kube-system

# […]

– job_name: kubernetes-pods-app
kubernetes_sd_configs:
– role: pod
relabel_configs:
– source_labels: [__meta_kubernetes_namespace]
action: keep
regex: kube-system

  1. Exclude logs from specific namespace

For example, if you want to exclude logs from kube-system namespace:

You can use the action: drop for your namespace and add a new relabel_configs for each scrape_config in promtail/configmap.yaml

scrape_configs:
– job_name: kubernetes-pods
kubernetes_sd_configs:
– role: pod
relabel_configs:
– source_labels: [__meta_kubernetes_namespace]
action: drop
regex: kube-system

# […]

– job_name: kubernetes-pods-app
kubernetes_sd_configs:
– role: pod
relabel_configs:
– source_labels: [__meta_kubernetes_namespace]
action: drop
regex: kube-system

For more info on the configuration, you can refer to the official Prometheus configuration documentation.

Use fluentd output plugin

Fluentd is a well-known and good log forwarder that is also a [CNCF project] (https://www.cncf.io/projects/). It has a lot of input plugins and good filtering built-in. So, if you want to for example, forward journald logs to Loki, it’s not possible via Promtail so you can use the fluentd syslog input plugin with the fluentd Loki output plugin to get those logs into Loki.

You can refer to the installation guide on how to use the fluentd Loki plugin.

There’s also an example, of how to forward API server audit logs to Loki with fluentd.

Here is the fluentd configuration:

<match fluent.**>
type null
</match>
<source>
@type tail
path /var/log/apiserver/audit.log
pos_file /var/log/fluentd-audit.log.pos
time_format %Y-%m-%dT%H:%M:%S.%NZ
tag audit.*
format json
read_from_head true
</source>
<filter kubernetes.**>
type kubernetes_metadata
</filter>
<match audit.**>
@type loki
url “#”
username “#”
password “#”
extra_labels {“env”:”dev”}
flush_interval 10s
flush_at_shutdown true
buffer_chunk_limit 1m
</match>

Promtail as a sidecar

By default, Promtail is configured to automatically scrape logs from containers and send them to Loki. Those logs come from stdout.

But sometimes, you may like to be able to send logs from an external file to Loki.

In this case, you can set up Promtail as a sidecar, i.e. a second container in your pod, share the log file with it through a shared volume, and scrape the data to send it to Loki

Assuming you have an application simple-logger. The application logs into /home/slog/creator.log

Your kubernetes deployment will look like this :

  1. Add Promtail as a sidecar

    apiVersion: apps/v1
    kind: Deployment
    metadata:
    name: my-app
    spec:
    template:
    metadata:
    name: my-app
    spec:
    containers:
    – name: simple-logger
    image: giantswarm/simple-logger:latest

    apiVersion: apps/v1
    kind: Deployment
    metadata:
    name: my-app
    spec:
    template:
    metadata:
    name: my-app
    spec:
    containers:
    – name: simple-logger
    image: giantswarm/simple-logger:latest
    – name: promtail
    image: grafana/promtail:master
    args:
    – “-config.file=/etc/promtail/promtail.yaml”
    – “-client.url=http://loki:3100/api/prom/push”

  2. Use a shared data volume containing the log file

    apiVersion: apps/v1
    kind: Deployment
    metadata:
    name: my-app
    spec:
    template:
    metadata:
    name: my-app
    spec:
    containers:
    – name: simple-logger
    image: giantswarm/simple-logger:latest
    volumeMounts:
    – name: shared-data
    mountPath: /home/slog
    – name: promtail
    image: grafana/promtail:master
    args:
    – “-config.file=/etc/promtail/promtail.yaml”
    – “-client.url=http://loki:3100/api/prom/push”
    volumeMounts:
    – name: shared-data
    mountPath: /home/slog
    volumes:
    – name: shared-data
    emptyDir: {}

  3. Configure Promtail to read your log file

As Promtail uses the same config as Prometheus, you can use the scrape_config type static_configs to read the file you want.

scrape_configs:
– job_name: system
entry_parser: raw
static_configs:
– targets:
– localhost
labels:
job: my-app
my-label: awesome
__path__: /home/slog/creator.log

And you’re done.

A running example can be found here

Conclusion

So Loki looks very promising. The footprint is very low. It integrates nicely with Grafana and Prometheus. Having the same labels as in Prometheus is very helpful to map incidents together and quickly find logs related to metrics. Another big point is the simple scalability, Loki is horizontally scalable by design.

As Loki is currently alpha software, install it and play with it. Then, join us on grafana.slack.com and add your feedback to make it better.

Interested in finding out how Giant Swarm handles the entire cloud native stack including Loki? Request your free trial of the Giant Swarm Infrastructure here.

Source

Kubernetes End-to-end Testing for Everyone

More and more components that used to be part of Kubernetes are now being developed outside of Kubernetes. For example, storage drivers used to be compiled into Kubernetes binaries, then were moved into stand-alone Flexvolume binaries on the host, and now are delivered as Container Storage Interface (CSI) drivers that get deployed in pods inside the Kubernetes cluster itself.

This poses a challenge for developers who work on such components: how can end-to-end (E2E) testing on a Kubernetes cluster be done for such external components? The E2E framework that is used for testing Kubernetes itself has all the necessary functionality. However, trying to use it outside of Kubernetes was difficult and only possible by carefully selecting the right versions of a large number of dependencies. E2E testing has become a lot simpler in Kubernetes 1.13.

This blog post summarizes the changes that went into Kubernetes 1.13. For CSI driver developers, it will cover the ongoing effort to also make the storage tests available for testing of third-party CSI drivers. How to use them will be shown based on two Intel CSI drivers:

Testing those drivers was the main motivation behind most of these enhancements.

E2E overview

E2E testing consists of several phases:

  • Implementing a test suite. This is the main focus of this blog post. The Kubernetes E2E framework is written in Go. It relies on Ginkgo for managing tests and Gomega for assertions. These tools support “behavior driven development”, which describes expected behavior in “specs”. In this blog post, “test” is used to reference an individual Ginkgo.It spec. Tests interact with the Kubernetes cluster using client-go.
  • Bringing up a test cluster. Tools like kubetest can help here.
  • Running an E2E test suite against that cluster. Ginkgo test suites can be run with the ginkgo tool or as a normal Go test with go test. Without any parameters, a Kubernetes E2E test suite will connect to the default cluster based on environment variables like KUBECONFIG, exactly like kubectl. Kubetest also knows how to run the Kubernetes E2E suite.

E2E framework enhancements in Kubernetes 1.13

All of the following enhancements follow the same basic pattern: they make the E2E framework more useful and easier to use outside of Kubernetes, without changing the behavior of the original Kubernetes e2e.test binary.

Splitting out provider support

The main reason why using the E2E framework from Kubernetes <= 1.12 was difficult were the dependencies on provider-specific SDKs, which pulled in a large number of packages. Just getting it compiled was non-trivial.

Many of these packages are only needed for certain tests. For example, testing the mounting of a pre-provisioned volume must first provision such a volume the same way as an administrator would, by talking directly to a specific storage backend via some non-Kubernetes API.

There is an effort to remove cloud provider-specific tests from core Kubernetes. The approach taken in PR #68483 can be seen as an incremental step towards that goal: instead of ripping out the code immediately and breaking all tests that depend on it, all cloud provider-specific code was moved into optional packages under test/e2e/framework/providers. The E2E framework then accesses it via an interface that gets implemented separately by each vendor package.

The author of a E2E test suite decides which of these packages get imported into the test suite. The vendor support is then activated via the --provider command line flag. The Kubernetes e2e.test binary in 1.13 and 1.14 still contains support for the same providers as in 1.12. It is also okay to include no packages, which means that only the generic providers will be available:

  • “skeleton”: cluster is accessed via the Kubernetes API and nothing else
  • “local”: like “skeleton”, but in addition the scripts in kubernetes/kubernetes/cluster can retrieve logs via ssh after a test suite is run

External files

Tests may have to read additional files at runtime, like .yaml manifests. But the Kubernetes e2e.test binary is supposed to be usable and entirely stand-alone because that simplifies shipping and running it. The solution in the Kubernetes build system is to link all files under test/e2e/testing-manifestsinto the binary with go-bindata. The E2E framework used to have a hard dependency on the output of go-bindata, now bindata support is optional. When accessing a file via the testfiles package, files will be retrieved from different sources:

  • relative to the directory specified with --repo-root parameter
  • zero or more bindata chunks

Test parameters

The e2e.test binary takes additional parameters which control test execution. In 2016, an effort was started to replace all E2E command line parameters with a Viper configuration file. But that effort stalled, which left developers without clear guidance how they should handle test-specific parameters.

The approach in v1.12 was to add all flags to the central test/e2e/framework/test_context.go, which does not work for tests developed independently from the framework. Since PR #69105 the recommendation has been to use the normal flag package to define its parameters, in its own source code. Flag names must be hierarchical with dots separating different levels, for example my.test.parameter, and must be unique. Uniqueness is enforced by the flag package which panics when registering a flag a second time. The new config package simplifies the definition of multiple options, which are stored in a single struct.

To summarize, this is how parameters are handled now:

  • The init code in test packages defines tests and parameters. The actual parameter values are not available yet, so test definitions cannot use them.
  • The init code of the test suite parses parameters and (optionally) the configuration file.
  • The tests run and now can use parameter values.

However, recently it was pointed out that it is desirable and was possible to not expose test settings as command line flags and only set them via a configuration file. There is an open bug and a pending PR about this.

Viper support has been enhanced. Like the provider support, it is completely optional. It gets pulled into a e2e.test binary by importing the viperconfigpackage and calling it after parsing the normal command line flags. This has been implemented so that all variables which can be set via command line flags are also set when the flag appears in a Viper config file. For example, the Kubernetes v1.13 e2e.test binary accepts --viper-config=/tmp/my-config.yaml and that file will set the my.test.parameter to value when it has this content: my: test: parameter: value

In older Kubernetes releases, that option could only load a file from the current directory, the suffix had to be left out, and only a few parameters actually could be set this way. Beware that one limitation of Viper still exists: it works by matching config file entries against known flags, without warning about unknown config file entries and thus leaving typos undetected. A better config file parser for Kubernetes is still work in progress.

Creating items from .yaml manifests

In Kubernetes 1.12, there was some support for loading individual items from a .yaml file, but then creating that item had to be done by hand-written code. Now the framework has new methods for loading a .yaml file that has multiple items, patching those items (for example, setting the namespace created for the current test), and creating them. This is currently used to deploy CSI drivers anew for each test from exactly the same .yaml files that are also used for deployment via kubectl. If the CSI driver supports running under different names, then tests are completely independent and can run in parallel.

However, redeploying a driver slows down test execution and it does not cover concurrent operations against the driver. A more realistic test scenario is to deploy a driver once when bringing up the test cluster, then run all tests against that deployment. Eventually the Kubernetes E2E testing will move to that model, once it is clearer how test cluster bringup can be extended such that it also includes installing additional entities like CSI drivers.

Upcoming enhancements in Kubernetes 1.14

Reusing storage tests

Being able to use the framework outside of Kubernetes enables building a custom test suite. But a test suite without tests is still useless. Several of the existing tests, in particular for storage, can also be applied to out-of-tree components. Thanks to the work done by Masaki Kimura, storage tests in Kubernetes 1.13 are defined such that they can be instantiated multiple times for different drivers.

But history has a habit of repeating itself. As with providers, the package defining these tests also pulled in driver definitions for all in-tree storage backends, which in turn pulled in more additional packages than were needed. This has been fixed for the upcoming Kubernetes 1.14.

Skipping unsupported tests

Some of the storage tests depend on features of the cluster (like running on a host that supports XFS) or of the driver (like supporting block volumes). These conditions are checked while the test runs, leading to skipped tests when they are not satisfied. The good thing is that this records an explanation why the test did not run.

Starting a test is slow, in particular when it must first deploy the CSI driver, but also in other scenarios. Creating the namespace for a test has been measured at 5 seconds on a fast cluster, and it produces a lot of noisy test output. It would have been possible to address that by skipping the definition of unsupported tests, but then reporting why a test isn’t even part of the test suite becomes tricky. This approach has been dropped in favor of reorganizing the storage test suite such that it first checks conditions before doing the more expensive test setup steps.

More readable test definitions

The same PR also rewrites the tests to operate like conventional Ginkgo tests, with test cases and their local variables in a single function.

Testing external drivers

Building a custom E2E test suite is still quite a bit of work. The e2e.test binary that will get distributed in the Kubernetes 1.14 test archive will have the ability to test already installed storage drivers without rebuilding the test suite. See this README for further instructions.

E2E test suite HOWTO

Test suite initialization

The first step is to set up the necessary boilerplate code that defines the test suite. In Kubernetes E2E, this is done in the e2e.go and e2e_test.gofiles. It could also be done in a single e2e_test.go file. Kubernetes imports all of the various providers, in-tree tests, Viper configuration support, and bindata file lookup in e2e_test.goe2e.go controls the actual execution, including some cluster preparations and metrics collection.

A simpler starting point are the e2e_[test].go files from PMEM-CSI. It doesn’t use any providers, no Viper, no bindata, and imports just the storage tests.

Like PMEM-CSI, OIM drops all of the extra features, but is a bit more complex because it integrates a custom cluster startup directly into the test suite, which was useful in this case because some additional components have to run on the host side. By running them directly in the E2E binary, interactive debugging with dlv becomes easier.

Both CSI drivers follow the Kubernetes example and use the test/e2e directory for their test suites, but any other directory and other file names would also work.

Adding E2E storage tests

Tests are defined by packages that get imported into a test suite. The only thing specific to E2E tests is that they instantiate a framework.Frameworkpointer (usually called f) with framework.NewDefaultFramework. This variable gets initialized anew in a BeforeEach for each test and freed in an AfterEach. It has a f.ClientSet and f.Namespace at runtime (and only at runtime!) which can be used by a test.

The PMEM-CSI storage test imports the Kubernetes storage test suite and sets up one instance of the provisioning tests for a PMEM-CSI driver which must be already installed in the test cluster. The storage test suite changes the storage class to run tests with different filesystem types. Because of this requirement, the storage class is created from a .yaml file.

Explaining all the various utility methods available in the framework is out of scope for this blog post. Reading existing tests and the source code of the framework is a good way to get started.

Vendoring

Vendoring Kubernetes code is still not trivial, even after eliminating many of the unnecessary dependencies. k8s.io/kubernetes is not meant to be included in other projects and does not define its dependencies in a way that is understood by tools like dep. The other k8s.io packages are meant to be included, but don’t follow semantic versioning yet or don’t tag any releases (k8s.io/kube-openapik8s.io/utils).

PMEM-CSI uses dep. It’s Gopkg.toml file is a good starting point. It enables pruning (not enabled in dep by default) and locks certain projects onto versions that are compatible with the Kubernetes version that is used. When dep doesn’t pick a compatible version, then checking Kubernetes’Godeps.json helps to determine which revision might be the right one.

Compiling and running the test suite

go test ./test/e2e -args -help is the fastest way to test that the test suite compiles.

Once it does compile and a cluster has been set up, the command go test -timeout=0 -v ./test/e2e -ginkgo.v runs all tests. In order to run tests in parallel, use the ginkgo -p ./test/e2e command instead.

Getting involved

The Kubernetes E2E framework is owned by the testing-commons sub-project in SIG-testing. See that page for contact information.

There are various tasks that could be worked on, including but not limited to:

  • Moving test/e2e/framework into a staging repo and restructuring it so that it is more modular (#74352).
  • Simplifying e2e.go by moving more of its code into test/e2e/framework (#74353).
  • Removing provider-specific code from the Kubernetes E2E test suite (#70194).

Special thanks to the reviewers of this article:

Source

Comparing Kubernetes CNI Providers: Flannel, Calico, Canal, and Weave

Comparing Kubernetes CNI Providers: Flannel, Calico, Canal, and Weave

Introduction

Network architecture is one of the more complicated aspects of many Kubernetes installations. The Kubernetes networking model itself demands certain network features but allows for some flexibility regarding the implementation. As a result, various projects have been released to address specific environments and requirements.

In this article, we’ll explore the most popular CNI plugins: flannel, calico, weave, and canal (technically a combination of multiple plugins). CNI stands for container network interface, a standard designed to make it easy to configure container networking when containers are created or destroyed. These plugins do the work of making sure that Kubernetes’ networking requirements are satisfied and providing the networking features that cluster administrators require.

Background

Container networking is the mechanism through which containers can optionally connect to other containers, the host, and outside networks like the internet. Container runtimes offer various networking modes, each of which results in a different experience. For example Docker can configure the following networks for a container by default:

  • none: Adds the container to a container-specific network stack with no connectivity.
  • host: Adds the container to the host machine’s network stack, with no isolation.
  • default bridge: The default networking mode. Each container can connect with one another by IP address.
  • custom bridge: User-defined bridge networks with additional flexibility, isolation, and convenience features.

Docker also allows you to configure more advanced networking, including multi-host overlay networking, with additional drivers and plugins.

The idea behind the CNI initiative is to create a framework for dynamically configuring the appropriate network configuration and resources when containers are provisioned or destroyed. The CNI spec outlines a plugin interface for container runtimes to coordinate with plugins to configure networking.

Plugins are responsible for provisioning and managing an IP address to the interface and usually provide functionality related to IP management, IP-per-container assignment, and multi-host connectivity. The container runtime calls the networking plugins to allocate IP addresses and configure networking when the container starts and calls it again when the container is deleted to clean up those resources.

The runtime or orchestrator decides on the network a container should join and the plugin that it needs to call. The plugin then adds the interface into the container network namespace as one side of a veth pair. It then makes changes on the host machine, including wiring up the other part of the veth to a network bridge. Afterwards, it allocates an IP address and sets up routes by calling a separate IPAM (IP Address Management) plugin.

In the context of Kubernetes, this relationship allows kubelet to automatically configure networking for the pods it starts by calling the plugins it finds at appropriate times.

Terminology

Before we compare take a look at the available CNI plugins, it’s helpful to go over some terminology that you might see while reading this or other sources discussion CNI.

Some of the most common terms include:

  • Layer 2 networking: The “data link” layer of the OSI (Open Systems Interconnection) networking model. Layer 2 deals with delivery of frames between two adjacent nodes on a network. Ethernet is a noteworthy example of Layer 2 networking, with MAC represented as a sublayer.
  • Layer 3 networking: The “network” layer of the OSI networking model. Layer 3’s primary concern involves routing packets between hosts on top of the layer 2 connections. IPv4, IPv6, and ICMP are examples of Layer 3 networking protocols.
  • VXLAN: Stands for “virtual extensible LAN”. Primarily, VXLAN is used to help large cloud deployments scale by encapsulating layer 2 Ethernet frames within UDP datagrams. VXLAN virtualization is similar to VLAN, but offers more flexibility and power (VLANs were limited to only 4,096 network IDs). VXLAN is an encapsulation and overlay protocol that runs on top of existing networks.
  • Overlay network: An overlay network is a virtual, logical network built on top of an existing network. Overlay networks are often used to provide useful abstractions on top of existing networks and to separate and secure different logical networks.
  • Encapsulation: Encapsulation is the process of wrapping network packets in additional layer to provide additional context and information. In overlay networks, encapsulation is used to translate from the virtual network to the underlying address space to route to a different location (where the packet can be de-encapsulated and continue to its destination).
  • Mesh network: A mesh network is one in which each node connects to many other nodes to cooperate on routing and achieve greater connectivity. Network meshes provide more reliable networking by allowing routing through multiple paths. The downside of a network mesh is that each additional node can add significant overhead.
  • BGP: Stands for “border gateway protocol” and is used to manage how packets are routed between edge routers. BGP helps figure out how to send a packet from one network to another by taking into account available paths, routing rules, and specific network policies. BGP is sometimes used as the routing mechanism in CNI plugins instead of encapsulated overlay networks.

Now that we’ve introduced some of the technology that enables various plugins, we’re ready to explore some of the most popular CNI options.

CNI Comparison

Flannel

Flannel, a project developed by the CoreOS, is perhaps the most straightforward and popular CNI plugin available. It is one of the most mature examples of networking fabric for container orchestration systems, intended to allow for better inter-container and inter-host networking. As the CNI concept took off, a CNI plugin for Flannel was an early entry.

Compared to some other options, Flannel is relatively easy to install and configure. It is packaged as a single binary called flanneld and can be installed by default by many common Kubernetes cluster deployment tools and in many Kubernetes distributions. Flannel can use the Kubernetes cluster’s existing etcd cluster to store its state information using the API to avoid having to provision a dedicated data store.

Flannel configures a layer 3 IPv4 overlay network. A large internal network is created that spans across every node within the cluster. Within this overlay network, each node is given a subnet to allocate IP addresses internally. As pods are provisioned, the Docker bridge interface on each node allocates an address for each new container. Pods within the same host can communicate using the Docker bridge, while pods on different hosts will have their traffic encapsulated in UDP packets by flanneld for routing to the appropriate destination.

Flannel has several different types of backends available for encapsulation and routing. The default and recommended approach is to use VXLAN, as it offers both good performance and is less manual intervention than other options.

Overall, Flannel is a good choice for most users. From an administrative perspective, it offers a simple networking model that sets up an environment that’s suitable for most use cases when you only need the basics. In general, it’s a safe bet to start out with Flannel until you need something that it cannot provide.

Calico

Project Calico, or just Calico, is another popular networking option in the Kubernetes ecosystem. While Flannel is positioned as the simple choice, Calico is best known for its performance, flexibility, and power. Calico takes a more holistic view of networking, concerning itself not only with providing network connectivity between hosts and pods, but also with network security and administration. The Calico CNI plugin wraps Calico functionality within the CNI framework.

On a freshly provisioned Kubernetes cluster that meets the system requirements, Calico can be deployed quickly by applying a single manifest file. If you are interested in Calico’s optional network policy capabilities, you can enable them by applying an additional manifest to your cluster.

Although the actions needed to deploy Calico seem fairly straightforward, the network environment it creates has both simple and complex attributes. Unlike Flannel, Calico does not use an overlay network. Instead, Calico configures a layer 3 network that uses the BGP routing protocol to route packets between hosts. This means that packets do not need to be wrapped in an extra layer of encapsulation when moving between hosts. The BGP routing mechanism can direct packets natively without an extra step of wrapping traffic in an additional layer of traffic.

Besides the performance that this offers, one side effect of this is that it allows for more conventional troubleshooting when network problems arise. While encapsulated solutions using technologies like VXLAN work well, the process manipulates packets in a way that can make tracing difficult. With Calico, the standard debugging tools have access to the same information they would in simple environments, making it easier for a wider range of developers and administrators to understand behavior.

In addition to networking connectivity, Calico is well-known for its advanced network features. Network policy is one of its most sought after capabilities. In addition, Calico can also integrate with Istio, a service mesh, to interpret and enforce policy for workloads within the cluster both at the service mesh layer and the network infrastructure layer. This means that you can configure powerful rules describing how pods should be able to send and accept traffic, improving security and control over your networking environment.

Project Calico is a good choice for environments that support its requirements and when performance and features like network policy are important. Additionally, Calico offers commercial support if you’re seeking a support contract or want to keep that option open for the future. In general, it’s a good choice for when you want to be able to control your network instead of just configuring it once and forgetting about it.

Canal

Canal is an interesting option for quite a few reasons.

First of all, Canal was the name for a project that sought to integrate the networking layer provided by flannel with the networking policy capabilities of Calico. As the contributors worked through the details however, it became apparent that a full integration was not necessarily needed if work was done on both projects to ensure standardization and flexibility. As a result, the official project became somewhat defunct, but the intended ability to deploy the two technology together was achieved. For this reason, it’s still sometimes easiest to refer to the combination as “Canal” even if the project no longer exists.

Because Canal is a combination of Flannel and Calico, its benefits are also at the intersection of these two technologies. The networking layer is the simple overlay provided by Flannel that works across many different deployment environments without much additional configuration. The network policy capabilities layered on top supplement the base network with Calico’s powerful networking rule evaluation to provide additional security and control.

After ensuring that the cluster fulfills the necessary system requirements, Canal can be deployed by applying two manifests, making it no more difficult to configure than either of the projects on their own. Canal is a good way for teams to start to experiment and gain experience with network policy before they’re ready to experiment with changing their actual networking.

In general, Canal is a good choice if you like the networking model that Flannel provides but find some of Calico’s features enticing. The ability define network policy rules is a huge advantage from a security perspective and is, in many ways, Calico’s killer feature. Being able to apply that technology onto a familiar networking layer means that you can get a more capable environment without having to go through much of a transition.

Weave Net

Weave Net by Weaveworks is a CNI-capable networking option for Kubernetes that offers a different paradigm than the others we’ve discussed so far. Weave creates a mesh overlay network between each of the nodes in the cluster, allowing for flexible routing between participants. This, coupled with a few other unique features, allows Weave to intelligently route in situations that might otherwise cause problems.

To create its network, Weave relies on a routing component installed on each host in the network. These routers then exchange topology information to maintain an up-to-date view of the available network landscape. When looking to send traffic to a pod located on a different node, the weave router makes an automatic decision whether to send it via “fast datapath” or to fall back on the “sleeve” packet forwarding method.

Fast datapath is an approach that relies on the kernel’s native Open vSwitch datapath module to forward packets to the appropriate pod without moving in and out of userspace multiple times. The Weave router updates the Open vSwitch configuration to ensure that the kernel layer has accurate information about how to route incoming packets. In contrast, sleeve mode is available as a backup when the networking topology isn’t suitable for fast datapath routing. It is a slower encapsulation mode that can route packets in instances where fast datapath does not have the necessary routing information or connectivity. As traffic flows through the routers, they learn which peers are associated with which MAC addresses, allowing them to route more intelligently with fewer hops for subsequent traffic. This same mechanism helps each node self-correct when a network change alters the available routes.

Like Calico, Weave also provides network policy capabilities for your cluster. This is automatically installed and configured when you set up Weave, so no additional configuration is necessary beyond adding your network rules. One thing that Weave provides that the other options do not is easy encryption for the entire network. While it adds quite a bit of network overhead, Weave can be configured to automatically encrypt all routed traffic by using NaCl encryption for sleeve traffic and, since it needs to encrypt VXLAN traffic in the kernel, IPsec ESP for fast datapath traffic.

Weave is a great option for those looking for feature rich networking without adding a large amount of complexity or management. It is relatively easy to set up, offers many built-in and automatically configured features, and can provide routing in scenarios where other solutions might fail. The mesh topography does put a limit on the size of the network that can be reasonably accommodated, but for most users, this won’t be a problem. Additionally, Weave offers paid support for organizations that prefer to be able to have someone to contact for help and troubleshooting.

Conclusion

Kubernetes’ adoption of the CNI standard allows for many different network solutions to exist within the same ecosystem. The diversity of options available means that most users will be able to find a CNI plugin that suits their current needs and deployment environment, while also providing solutions when their circumstances change. Operating requirements vary immensely between organizations, so having a number of mature solutions with different levels of complexity and feature richness helps Kubernetes satisfy unique requirements while still offering a fairly consistent user experience.

Source

A Guide to Kubernetes Admission Controllers

Kubernetes has greatly improved the speed and manageability of backend clusters in production today. Kubernetes has emerged as the de facto standard in container orchestrators thanks to its flexibility, scalability, and ease of use. Kubernetes also provides a range of features that secure production workloads. A more recent introduction in security features is a set of plugins called “admission controllers.” Admission controllers must be enabled to use some of the more advanced security features of Kubernetes, such as pod security policies that enforce a security configuration baseline across an entire namespace. The following must-know tips and tricks will help you leverage admission controllers to make the most of these security capabilities in Kubernetes.

What are Kubernetes admission controllers?

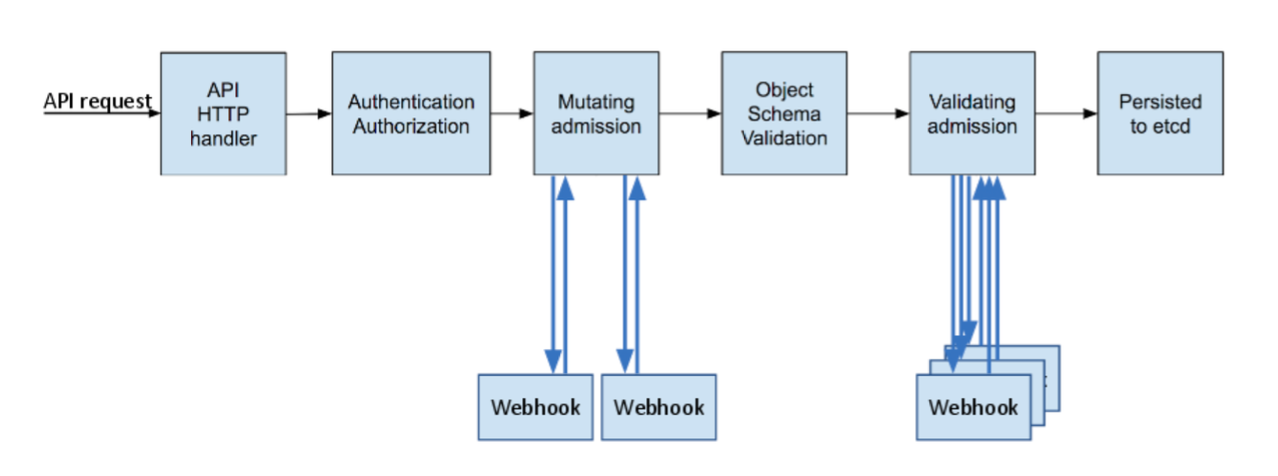
In a nutshell, Kubernetes admission controllers are plugins that govern and enforce how the cluster is used. They can be thought of as a gatekeeper that intercept (authenticated) API requests and may change the request object or deny the request altogether. The admission control process has two phases: the mutating phase is executed first, followed by the validating phase. Consequently, admission controllers can act as mutating or validating controllers or as a combination of both. For example, the LimitRanger admission controller can augment pods with default resource requests and limits (mutating phase), as well as verify that pods with explicitly set resource requirements do not exceed the per-namespace limits specified in the LimitRange object (validating phase).

Admission Controller Phases

It is worth noting that some aspects of Kubernetes’ operation that many users would consider built-in are in fact governed by admission controllers. For example, when a namespace is deleted and subsequently enters the Terminating state, the NamespaceLifecycle admission controller is what prevents any new objects from being created in this namespace.

Among the more than 30 admission controllers shipped with Kubernetes, two take a special role because of their nearly limitless flexibility – ValidatingAdmissionWebhooks and MutatingAdmissionWebhooks, both of which are in beta status as of Kubernetes 1.13. We will examine these two admission controllers closely, as they do not implement any policy decision logic themselves. Instead, the respective action is obtained from a REST endpoint (a webhook) of a service running inside the cluster. This approach decouples the admission controller logic from the Kubernetes API server, thus allowing users to implement custom logic to be executed whenever resources are created, updated, or deleted in a Kubernetes cluster.

The difference between the two kinds of admission controller webhooks is pretty much self-explanatory: mutating admission webhooks may mutate the objects, while validating admission webhooks may not. However, even a mutating admission webhook can reject requests and thus act in a validating fashion. Validating admission webhooks have two main advantages over mutating ones: first, for security reasons it might be desirable to disable the MutatingAdmissionWebhook admission controller (or apply stricter RBAC restrictions as to who may create MutatingWebhookConfigurationobjects) because of its potentially confusing or even dangerous side effects. Second, as shown in the previous diagram, validating admission controllers (and thus webhooks) are run after any mutating ones. As a result, whatever request object a validating webhook sees is the final version that would be persisted to etcd.

The set of enabled admission controllers is configured by passing a flag to the Kubernetes API server. Note that the old –admission-control flag was deprecated in 1.10 and replaced with –enable-admission-plugins.

--enable-admission-plugins=ValidatingAdmissionWebhook,MutatingAdmissionWebhook

Kubernetes recommends the following admission controllers to be enabled by default.

--enable-admission-plugins=NamespaceLifecycle,LimitRanger,ServiceAccount,DefaultStorageClass,DefaultTolerationSeconds,MutatingAdmissionWebhook,ValidatingAdmissionWebhook,Priority,ResourceQuota,PodSecurityPolicy

The complete list of admission controllers with their descriptions can be found in the official Kubernetes reference. This discussion will focus only on the webhook-based admission controllers.

Why do I need admission controllers?

  • Security: Admission controllers can increase security by mandating a reasonable security baseline across an entire namespace or cluster. The built-in PodSecurityPolicy admission controller is perhaps the most prominent example; it can be used for disallowing containers from running as root or making sure the container’s root filesystem is always mounted read-only, for example. Further use cases that can be realized by custom, webhook-based admission controllers include:
    • Allow pulling images only from specific registries known to the enterprise, while denying unknown image registries.
    • Reject deployments that do not meet security standards. For example, containers using the privileged flag can circumvent a lot of security checks. This risk could be mitigated by a webhook-based admission controller that either rejects such deployments (validating) or overrides the privileged flag, setting it to false.
  • Governance: Admission controllers allow you to enforce the adherence to certain practices such as having good labels, annotations, resource limits, or other settings. Some of the common scenarios include:
    • Enforce label validation on different objects to ensure proper labels are being used for various objects, such as every object being assigned to a team or project, or every deployment specifying an app label.
    • Automatically add annotations to objects, such as attributing the correct cost center for a “dev” deployment resource.
  • Configuration management: Admission controllers allow you to validate the configuration of the objects running in the cluster and prevent any obvious misconfigurations from hitting your cluster. Admission controllers can be useful in detecting and fixing images deployed without semantic tags, such as by:
    • automatically adding resource limits or validating resource limits,
    • ensuring reasonable labels are added to pods, or
    • ensuring image references used in production deployments are not using the latest tags, or tags with a -dev suffix.

In this way, admission controllers and policy management help make sure that applications stay in compliance within an ever-changing landscape of controls.

Example: Writing and Deploying an Admission Controller Webhook

To illustrate how admission controller webhooks can be leveraged to establish custom security policies, let’s consider an example that addresses one of the shortcomings of Kubernetes: a lot of its defaults are optimized for ease of use and reducing friction, sometimes at the expense of security. One of these settings is that containers are by default allowed to run as root (and, without further configuration and no USER directive in the Dockerfile, will also do so). Even though containers are isolated from the underlying host to a certain extent, running containers as root does increase the risk profile of your deployment— and should be avoided as one of many security best practices. The recently exposed runC vulnerability (CVE-2019-5736), for example, could be exploited only if the container ran as root.

You can use a custom mutating admission controller webhook to apply more secure defaults: unless explicitly requested, our webhook will ensure that pods run as a non-root user (we assign the user ID 1234 if no explicit assignment has been made). Note that this setup does not prevent you from deploying any workloads in your cluster, including those that legitimately require running as root. It only requires you to explicitly enable this risker mode of operation in the deployment configuration, while defaulting to non-root mode for all other workloads.

The full code along with deployment instructions can be found in our accompanying GitHub repository. Here, we will highlight a few of the more subtle aspects about how webhooks work.

Mutating Webhook Configuration

A mutating admission controller webhook is defined by creating a MutatingWebhookConfiguration object in Kubernetes. In our example, we use the following configuration:

apiVersion: admissionregistration.k8s.io/v1beta1
kind: MutatingWebhookConfiguration
metadata:
  name: demo-webhook
webhooks:
  - name: webhook-server.webhook-demo.svc
    clientConfig:
      service:
        name: webhook-server
        namespace: webhook-demo
        path: "/mutate"
      caBundle: ${CA_PEM_B64}
    rules:
      - operations: [ "CREATE" ]
        apiGroups: [""]
        apiVersions: ["v1"]
        resources: ["pods"]

This configuration defines a webhook webhook-server.webhook-demo.svc, and instructs the Kubernetes API server to consult the service webhook-server in namespace webhook-demo whenever a pod is created by making a HTTP POST request to the /mutate URL. For this configuration to work, several prerequisites have to be met.

Webhook REST API

The Kubernetes API server makes an HTTPS POST request to the given service and URL path, with a JSON-encoded AdmissionReview (with the Request field set) in the request body. The response should in turn be a JSON-encoded AdmissionReview, this time with the Response field set.

Our demo repository contains a function that takes care of the serialization/deserialization boilerplate code and allows you to focus on implementing the logic operating on Kubernetes API objects. In our example, the function implementing the admission controller logic is called applySecurityDefaults, and an HTTPS server serving this function under the /mutate URL can be set up as follows:

mux := http.NewServeMux()
mux.Handle("/mutate", admitFuncHandler(applySecurityDefaults))
server := &http.Server{
  Addr:    ":8443",
  Handler: mux,
}
log.Fatal(server.ListenAndServeTLS(certPath, keyPath))

Note that for the server to run without elevated privileges, we have the HTTP server listen on port 8443. Kubernetes does not allow specifying a port in the webhook configuration; it always assumes the HTTPS port 443. However, since a service object is required anyway, we can easily map port 443 of the service to port 8443 on the container:

apiVersion: v1
kind: Service
metadata:
  name: webhook-server
  namespace: webhook-demo
spec:
  selector:
    app: webhook-server  # specified by the deployment/pod
  ports:
    - port: 443
      targetPort: webhook-api  # name of port 8443 of the container

Object Modification Logic

In a mutating admission controller webhook, mutations are performed via JSON patches. While the JSON patch standard includes a lot of intricacies that go well beyond the scope of this discussion, the Go data structure in our example as well as its usage should give the user a good initial overview of how JSON patches work:

type patchOperation struct {
  Op    string      `json:"op"`
  Path  string      `json:"path"`
  Value interface{} `json:"value,omitempty"`
}

For setting the field .spec.securityContext.runAsNonRoot of a pod to true, we construct the following patchOperation object:

patches = append(patches, patchOperation{
  Op:    "add",
  Path:  "/spec/securityContext/runAsNonRoot",
  Value: true,
})

TLS Certificates

Since a webhook must be served via HTTPS, we need proper certificates for the server. These certificates can be self-signed (rather: signed by a self-signed CA), but we need Kubernetes to instruct the respective CA certificate when talking to the webhook server. In addition, the common name (CN) of the certificate must match the server name used by the Kubernetes API server, which for internal services is <service-name>.<namespace>.svc, i.e., webhook-server.webhook-demo.svc in our case. Since the generation of self-signed TLS certificates is well documented across the Internet, we simply refer to the respective shell script in our example.

The webhook configuration shown previously contains a placeholder ${CA_PEM_B64}. Before we can create this configuration, we need to replace this portion with the Base64-encoded PEM certificate of the CA. The openssl base64 -A command can be used for this purpose.

Testing the Webhook

After deploying the webhook server and configuring it, which can be done by invoking the ./deploy.sh script from the repository, it is time to test and verify that the webhook indeed does its job. The repository contains three examples:

  • A pod that does not specify a security context (pod-with-defaults). We expect this pod to be run as non-root with user id 1234.
  • A pod that does specify a security context, explicitly allowing it to run as root (pod-with-override).
  • A pod with a conflicting configuration, specifying it must run as non-root but with a user id of 0 (pod-with-conflict). To showcase the rejection of object creation requests, we have augmented our admission controller logic to reject such obvious misconfigurations.

Create one of these pods by running kubectl create -f examples/<name>.yaml. In the first two examples, you can verify the user id under which the pod ran by inspecting the logs, for example:

$ kubectl create -f examples/pod-with-defaults.yaml
$ kubectl logs pod-with-defaults
I am running as user 1234

In the third example, the object creation should be rejected with an appropriate error message:

$ kubectl create -f examples/pod-with-conflict.yaml
Error from server (InternalError): error when creating "examples/pod-with-conflict.yaml": Internal error occurred: admission webhook "webhook-server.webhook-demo.svc" denied the request: runAsNonRoot specified, but runAsUser set to 0 (the root user)

Feel free to test this with your own workloads as well. Of course, you can also experiment a little bit further by changing the logic of the webhook and see how the changes affect object creation. More information on how to do experiment with such changes can be found in the repository’s readme.

Summary

Kubernetes admission controllers offer significant advantages for security. Digging into two powerful examples, with accompanying available code, will help you get started on leveraging these powerful capabilities.

References:

Source

Tarmak 0.6 released

We are excited to announce the release of Tarmak, 0.6! If unfamiliar,
Tarmak is a CLI toolkit to provision and manage
Kubernetes clusters on AWS with security-first principles. This new release
gives a host of great new features and improvements which I’ll describe below.

  • Worker node AMI images
  • Pre-Built Default AMI Image
  • Calico Kubernetes Backend
  • New CLI commands – cluster logs and environment destroy
  • Using Kubernetes Addon-manager
  • Using an in package solution to SSH with a secure approach to public key
    advertising

Runway

Worker Node AMI Images and Default Image

In this release we have a new image type that can be assigned to your worker
instance pools – centos-puppet-agent-k8s-worker. This image type causes
Tarmak to pre-install all the node components when building the AMI image,
rather than installing them at boot time. This means that time from boot to
node status Ready is greatly reduced, giving more resources to your triggered
scaling groups faster.

We have also created a public AMI image. If no privately built images are
available for your cluster, Tarmak will use the Jetstack’s published image
instead. This change is great for new users as they can get a new cluster up and
running faster, without having to wait for long build times.

Calico Kubernetes Backend

We’ve added new options for how you deploy Calico into your clusters. Instead of
using Etcd, the default Calico backend, we now give the option to use Kubernetes
with a toggle in the Tarmak configuration. Deploying a huge cluster? With this
option you can also choose to deploy
Typha which will help with the load of
Calico on the Kubernetes backend. This is also simply enabled and configured
through the Tarmak configuration which you can read how
here.

New CLI Commands

In the unfortunate event you’re having issues with your cluster and seeking some
support, it is always a pain to copy and paste logs from your components running
on multiple machines. This is very time consuming and always seems like the logs
you missed are the most needed! To help with this, we’ve created a new command
cluster logs that will go ahead and fetch all systemd logs from your targeted
instance pools (vault, workers, control-plane etc.), bundle them up into a
reader friendly file structure and compressed into a tar ball. This is then
ready to be shipped off to someone else over the net. This is really beneficial
in making the support feedback loop more efficient and a great quality of life
improvement.

Another CLI command change that we’ve added is the addition of environment
destroy. As it sounds, this is the big brother to cluster destory and will
destroy all clusters in the environment, including the hub. This is a command
that’s helped us a lot internally, and is another nice quality of life
+improvement. Do be careful though that you’re sure you want to run it!

Kubernetes Addon-manager

We are now using the Kubernetes
Addon-manager
which is a controller like service that runs on master nodes of Tarmak. The
service is constantly watching for resources in Kubernetes with a label and
comparing them with local manifests inside a directory. If resources are changed
or removed from the local manifest set, the Addon-manager will then update them
in Kubernetes to keep it in sync.

This has been working really well for Tarmak deployments and has been handling
updates and migrations well. For example when you upgrade your cluster to 1.10
or higher, we now install
CoreDNS over
Kube-dns
which Addon-manager will replace. Addon-manager also helps to seamlessly
reconfigure Calico if it’s deployment has been changed in the Tarmak
configuration described earlier.

SSH Overhaul and Instance Public Key Advertising

With this release, we’ve also made some huge changes to how we are creating and
managing our SSH connections. This is one of the core components of Tarmak as it
enables connections to components such as wing – a small binary sitting on all
nodes to report it’s state and implement configuration updates – or creating
tunnels that allow initialisation and communication with vault as well as
accessing the Kubernetes API server when not using a public load balancer
endpoint. Previously, we had been using the OpenSSH client on your machine to
create and manage these connections however, has now been replaced with a custom
SSH client that uses the standard Go SSH library. What does this mean for
users? Connections should now be much more reliable and we can now use these
connections more efficiently. It has also enabled us to develop more
sophisticated features such as the log aggregation command mentioned earlier and
mitigate problems caused by inconsistencies between OpenSSH versions installed
on different machines.

With this change we have also updated the way we handle verifying instance’s
public keys that we SSH to along with managing the local SSH hosts file. Now
when an instance boots, wing will gather the public keys, sign its AWS identity
document with them and send them all to an Amazon Lambda function. Once the
function has verified these keys, it will tag that instance with them. Once an
instance has been tagged, they will not be changed. Locally Tarmak can use
these to populate the local hosts file and be used to verify SSH connections
to the instance. This change bolsters security for connecting to the
cluster.

Runway

Other features include improving the reliability of bootstrapping vault
instances, updates to components and some bug fixes. You can read more in the CHANGELOG or on the GitHub release page.

Give the release a go,
we look forward to hearing your feedback!

Source

KubeEdge, a Kubernetes Native Edge Computing Framework

KubeEdge becomes the first Kubernetes Native Edge Computing Platform with both Edge and Cloud components open sourced!

Open source edge computing is going through its most dynamic phase of development in the industry. So many open source platforms, so many consolidations and so many initiatives for standardization! This shows the strong drive to build better platforms to bring cloud computing to the edges to meet ever increasing demand. KubeEdge, which was announced last year, now brings great news for cloud native computing! It provides a complete edge computing solution based on Kubernetes with separate cloud and edge core modules. Currently, both the cloud and edge modules are open sourced.

Unlike certain light weight kubernetes platforms available around, KubeEdge is made to build edge computing solutions extending the cloud. The control plane resides in cloud, though scalable and extendable. At the same time, the edge can work in offline mode. Also it is lightweight and containerized, and can support heterogeneous hardware at the edge. With the optimization in edge resource utlization, KubeEdge positions to save significant setup and operation cost for edge solutions. This makes it the most compelling edge computing platform in the world currently, based on Kubernetes!

Kube(rnetes)Edge! – Opening up a new Kubernetes-based ecosystem for Edge Computing

The key goal for KubeEdge is extending Kubernetes ecosystem from cloud to edge. From the time it was announced to the public at KubeCon in Shanghai in November 2018, the architecture direction for KubeEdge was aligned to Kubernetes, as its name!

It started with its v0.1 providing the basic edge computing features. Now, with its latest release v0.2, it brings the cloud components to connect and complete the loop. With consistent and scalable Kubernetes-based interfaces, KubeEdge enables the orchestration and management of edge clusters similar to how Kubernetes manages in the cloud. This opens up seamless possibilities of bringing cloud computing capabilities to the edge, quickly and efficiently.

KubeEdge Links:

Based on its roadmap and architecture, KubeEdge tries to support all edge nodes, applications, devices and even the cluster management consistent with the Kuberenetes interface. This will help the edge cloud act exactly like a cloud cluster. This can save a lot of time and cost on the edge cloud development deployment based on KubeEdge.

KubeEdge provides a containerized edge computing platform, which is inherently scalable. As it’s modular and optimized, it is lightweight (66MB foot print and ~30MB running memory) and could be deployed on low resource devices. Similarly, the edge node can be of different hardware architecture and with different hardware configurations. For the device connectivity, it can support multiple protocols and it uses a standard MQTT-based communication. This helps in scaling the edge clusters with new nodes and devices efficiently.

You heard it right!

KubeEdge Cloud Core modules are open sourced!

By open sourcing both the edge and cloud modules, KubeEdge brings a complete cloud vendor agnostic lightweight heterogeneous edge computing platform. It is now ready to support building a complete Kubernetes ecosystem for edge computing, exploiting most of the existing cloud native projects or software modules. This can enable a mini-cloud at the edge to support demanding use cases like data analytics, video analytics, machine learning and more.

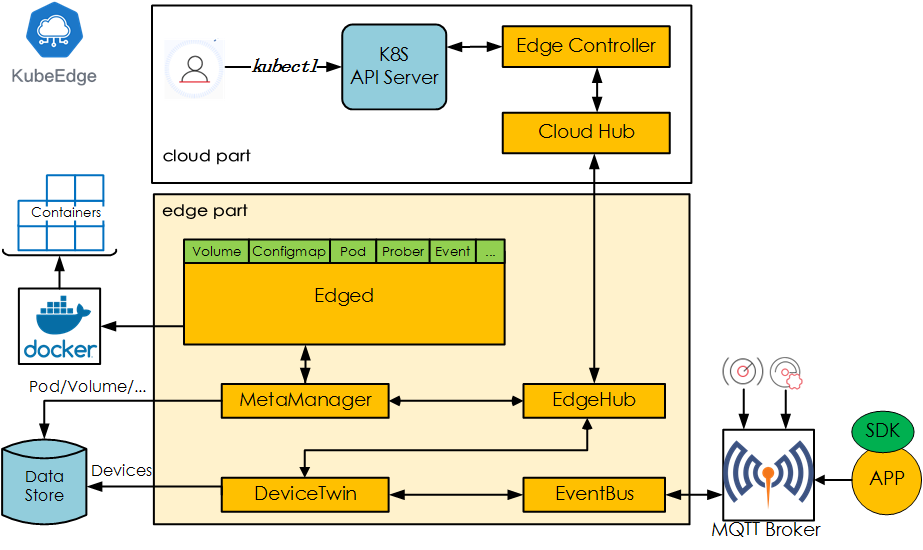
KubeEdge Architecture: Building Kuberenetes Native Edge computing!

The core architecture tenet for KubeEdge is to build interfaces that are consistent with Kubernetes, be it on the cloud side or edge side.

Edged: Manages containerized Applications at the Edge.

EdgeHub: Communication interface module at the Edge. It is a web socket client responsible for interacting with Cloud Service for edge computing.

CloudHub: Communication interface module at the Cloud. A web socket server responsible for watching changes on the cloud side, caching and sending messages to EdgeHub.

EdgeController: Manages the Edge nodes. It is an extended Kubernetes controller which manages edge nodes and pods metadata so that the data can be targeted to a specific edge node.

EventBus: Handles the internal edge communications using MQTT. It is an MQTT client to interact with MQTT servers (mosquitto), offering publish and subscribe capabilities to other components.

DeviceTwin: It is software mirror for devices that handles the device metadata. This module helps in handling device status and syncing the same to cloud. It also provides query interfaces for applications, as it interfaces to a lightweight database (SQLite).

MetaManager: It manages the metadata at the edge node. This is the message processor between edged and edgehub. It is also responsible for storing/retrieving metadata to/from a lightweight database (SQLite).

Even if you want to add more control plane modules based on the architecture refinement and improvement (for example enhanced security), it is simple as it uses consistent registration and modular communication within these modules.

KubeEdge provides scalable lightweight Kubernetes Native Edge Computing Platform which can work in offline mode.

It helps simplify edge application development and deployment.

Cloud vendor agnostic and can run the cloud core modules on any compute node.

Release 0.1 to 0.2 – game changer!

KubeEdge v0.1 was released at the end of December 2018 with very basic edge features to manage edge applications along with Kubernetes API primitives for node, pod, config etc. In ~2 months, KubeEdge v0.2 was release on March 5th, 2019. This release provides the cloud core modules and enables the end to end open source edge computing solution. The cloud core modules can be deployed to any compute node from any cloud vendors or on-prem.

Now, the complete edge solution can be installed and tested very easily, also with a laptop.

Run Anywhere – Simple and Light

As described, the KubeEdge Edge and Cloud core components can be deployed easily and can run the user applications. The edge core has a foot print of 66MB and just needs 30MB memory to run. Similarly the cloud core can run on any cloud nodes. (User can experience by running it on a laptop as well)

The installation is simple and can be done in few steps:

  1. Setup the pre-requisites Docker, Kubernetes, MQTT and openssl
  2. Clone and Build KubeEdge Cloud and Edge
  3. Run Cloud
  4. Run Edge

The detailed steps for each are available at KubeEdge/kubeedge

Future: Taking off with competent features and community collaboration

KubeEdge has been developed by members from the community who are active contributors to Kubernetes/CNCF and doing research in edge computing. The KubeEdge team is also actively collaborating with Kubernetes IOT/EDGE WORKING GROUP. Within a few months of the KubeEdge announcement it has attracted members from different organizations including JingDong, Zhejiang University, SEL Lab, Eclipse, China Mobile, ARM, Intel to collaborate in building the platform and ecosystem.

KubeEdge has a clear roadmap for its upcoming major releases in 2019. vc1.0 targets to provide a complete edge cluster and device management solution with standard edge to edge communication, while v2.0 targets to have advanced features like service mesh, function service , data analytics etc at edge. Also, for all the features, KubeEdge architecture would attempt to utilize the existing CNCF projects/software.

The KubeEdge community needs varied organizations, their requirements, use cases and support to build it. Please join to make a kubernetes native edge computing platform which can extend the cloud native computing paradigm to edge cloud.

How to Get Involved?

We welcome more collaboration to build the Kubernetes native edge computing ecosystem. Please join us!

Source

Kubernetes Setup Using Ansible and Vagrant

Objective

This blog post describes the steps required to setup a multi node Kubernetes cluster for development purposes. This setup provides a production-like cluster that can be setup on your local machine.

Why do we require multi node cluster setup?

Multi node Kubernetes clusters offer a production-like environment which has various advantages. Even though Minikube provides an excellent platform for getting started, it doesn’t provide the opportunity to work with multi node clusters which can help solve problems or bugs that are related to application design and architecture. For instance, Ops can reproduce an issue in a multi node cluster environment, Testers can deploy multiple versions of an application for executing test cases and verifying changes. These benefits enable teams to resolve issues faster which make the more agile.

Why use Vagrant and Ansible?

Vagrant is a tool that will allow us to create a virtual environment easily and it eliminates pitfalls that cause the works-on-my-machine phenomenon. It can be used with multiple providers such as Oracle VirtualBox, VMware, Docker, and so on. It allows us to create a disposable environment by making use of configuration files.

Ansible is an infrastructure automation engine that automates software configuration management. It is agentless and allows us to use SSH keys for connecting to remote machines. Ansible playbooks are written in yaml and offer inventory management in simple text files.

Prerequisites

  • Vagrant should be installed on your machine. Installation binaries can be found here.
  • Oracle VirtualBox can be used as a Vagrant provider or make use of similar providers as described in Vagrant’s official documentation.
  • Ansible should be installed in your machine. Refer to the Ansible installation guide for platform specific installation.

Setup overview

We will be setting up a Kubernetes cluster that will consist of one master and two worker nodes. All the nodes will run Ubuntu Xenial 64-bit OS and Ansible playbooks will be used for provisioning.

Step 1: Creating a Vagrantfile

Use the text editor of your choice and create a file with named Vagrantfile, inserting the code below. The value of N denotes the number of nodes present in the cluster, it can be modified accordingly. In the below example, we are setting the value of N as 2.

IMAGE_NAME = "bento/ubuntu-16.04"
N = 2

Vagrant.configure("2") do |config|
    config.ssh.insert_key = false

    config.vm.provider "virtualbox" do |v|
        v.memory = 1024
        v.cpus = 2
    end
      
    config.vm.define "k8s-master" do |master|
        master.vm.box = IMAGE_NAME
        master.vm.network "private_network", ip: "192.168.50.10"
        master.vm.hostname = "k8s-master"
        master.vm.provision "ansible" do |ansible|
            ansible.playbook = "kubernetes-setup/master-playbook.yml"
        end
    end

    (1..N).each do |i|
        config.vm.define "node-#{i}" do |node|
            node.vm.box = IMAGE_NAME
            node.vm.network "private_network", ip: "192.168.50.#{i + 10}"
            node.vm.hostname = "node-#{i}"
            node.vm.provision "ansible" do |ansible|
                ansible.playbook = "kubernetes-setup/node-playbook.yml"
            end
        end
    end

Step 2: Create an Ansible playbook for Kubernetes master.

Create a directory named kubernetes-setup in the same directory as the Vagrantfile. Create two files named master-playbook.yml and node-playbook.yml in the directory kubernetes-setup.

In the file master-playbook.yml, add the code below.

Step 2.1: Install Docker and its dependent components.

We will be installing the following packages, and then adding a user named “vagrant” to the “docker” group. – docker-ce – docker-ce-cli – containerd.io

---
- hosts: all
  become: true
  tasks:
  - name: Install packages that allow apt to be used over HTTPS
    apt:
      name: "{{ packages }}"
      state: present
      update_cache: yes
    vars:
      packages:
      - apt-transport-https
      - ca-certificates
      - curl
      - gnupg-agent
      - software-properties-common

  - name: Add an apt signing key for Docker
    apt_key:
      url: https://download.docker.com/linux/ubuntu/gpg
      state: present

  - name: Add apt repository for stable version
    apt_repository:
      repo: deb [arch=amd64] https://download.docker.com/linux/ubuntu xenial stable
      state: present

  - name: Install docker and its dependecies
    apt: 
      name: "{{ packages }}"
      state: present
      update_cache: yes
    vars:
      packages:
      - docker-ce 
      - docker-ce-cli 
      - containerd.io
    notify:
      - docker status

  - name: Add vagrant user to docker group
    user:
      name: vagrant
      group: docker

Step 2.2: Kubelet will not start if the system has swap enabled, so we are disabling swap using the below code.

  - name: Remove swapfile from /etc/fstab
    mount:
      name: "{{ item }}"
      fstype: swap
      state: absent
    with_items:
      - swap
      - none

  - name: Disable swap
    command: swapoff -a
    when: ansible_swaptotal_mb > 0

Step 2.3: Installing kubelet, kubeadm and kubectl using the below code.

  - name: Add an apt signing key for Kubernetes
    apt_key:
      url: https://packages.cloud.google.com/apt/doc/apt-key.gpg
      state: present

  - name: Adding apt repository for Kubernetes
    apt_repository:
      repo: deb https://apt.kubernetes.io/ kubernetes-xenial main
      state: present
      filename: kubernetes.list

  - name: Install Kubernetes binaries
    apt: 
      name: "{{ packages }}"
      state: present
      update_cache: yes
    vars:
      packages:
        - kubelet 
        - kubeadm 
        - kubectl

Step 2.3: Initialize the Kubernetes cluster with kubeadm using the below code (applicable only on master node).

  - name: Initialize the Kubernetes cluster using kubeadm
    command: kubeadm init --apiserver-advertise-address="192.168.50.10" --apiserver-cert-extra-sans="192.168.50.10"  --node-name k8s-master --pod-network-cidr=192.168.0.0/16

Step 2.4: Setup the kube config file for the vagrant user to access the Kubernetes cluster using the below code.

  - name: Setup kubeconfig for vagrant user
    command: "{{ item }}"
    with_items:
     - mkdir -p /home/vagrant/.kube
     - cp -i /etc/kubernetes/admin.conf /home/vagrant/.kube/config
     - chown vagrant:vagrant /home/vagrant/.kube/config

Step 2.5: Setup the container networking provider and the network policy engine using the below code.

  - name: Install calico pod network
    become: false
    command: kubectl create -f https://docs.projectcalico.org/v3.4/getting-started/kubernetes/installation/hosted/calico.yaml

Step 2.6: Generate kube join command for joining the node to the Kubernetes cluster and store the command in the file named join-command.

  - name: Generate join command
    command: kubeadm token create --print-join-command
    register: join_command

  - name: Copy join command to local file
    local_action: copy content="{{ join_command.stdout_lines[0] }}" dest="./join-command"

Step 2.7: Setup a handler for checking Docker daemon using the below code.

  handlers:
    - name: docker status
      service: name=docker state=started

Step 3: Create the Ansible playbook for Kubernetes node.

Create a file named node-playbook.yml in the directory kubernetes-setup.

Add the code below into node-playbook.yml

Step 3.1: Start adding the code from Steps 2.1 till 2.3.

Step 3.2: Join the nodes to the Kubernetes cluster using below code.

  - name: Copy the join command to server location
    copy: src=join-command dest=/tmp/join-command.sh mode=0777

  - name: Join the node to cluster
    command: sh /tmp/join-command.sh

Step 3.3: Add the code from step 2.7 to finish this playbook.

Step 4: Upon completing the Vagrantfile and playbooks follow the below steps.

$ cd /path/to/Vagrantfile
$ vagrant up

Upon completion of all the above steps, the Kubernetes cluster should be up and running. We can login to the master or worker nodes using Vagrant as follows:

$ ## Accessing master
$ vagrant ssh k8s-master
vagrant@k8s-master:~$ kubectl get nodes
NAME         STATUS   ROLES    AGE     VERSION
k8s-master   Ready    master   18m     v1.13.3
node-1       Ready    <none>   12m     v1.13.3
node-2       Ready    <none>   6m22s   v1.13.3

$ ## Accessing nodes
$ vagrant ssh node-1
$ vagrant ssh node-2

Source

What Is Jenkins X and How It Differs from Jenkins and CloudBees Core

An End to the Confusion: Jenkins or Jenkins X

Jenkins has served as a continuous integration (CI) tool long before the emergence of Kubernetes and distributed systems running on cloud native platforms. Working with Jenkins as a stand-alone open source tool — as developers and operations folks will be the first to say — can also be extremely difficult.

Now, more recently, the shift to cloud native and Kubernetes poses even more Jenkins management-specific challenges for organizations. As a result, Jenkins X has emerged as a way to both improve and automate continuous delivery pipelines to Kubernetes and cloud native environments. For many, however, there is a concern about compatibility between Jenkins and Jenkins X pipelines. And the role of each is also a worry expressed in forum posts and comments on Reddit and other outlets.

Indeed, understanding the role of each, the changing landscape of Jenkins, as well as the role CloudBees — the commercial distribution of Jenkins — plays, as enterprises continue to work with pipelines for on-premise, cloud native or a combination of both types of deployments, has also served as a source of confusion.

The short answer is that Jenkins X is indeed geared for Kubernetes deployments — but that does not mean it necessarily needs to replace existing Jenkins configurations, at least in the immediate. Nor does that means Jenkins X is unable to manage Jenkins pipelines for on-premise or non-cloud production pipelines. Meanwhile, CloudBees is applicable for both. Hence lies the source of difficulty in understanding the roles each can play.

“It’s quite a leap for the people to understand — basically, we see lots of confusion. Plus a lot of things are changing and we see [even more] confusion,” James Strachan, senior architect at CloudBees, the project lead on Jenkins X, said. “ And inside CloudBees and with our customers there’s a lot of misunderstanding out there. I hope we can make this a little bit clearer. I think it’s supposed to be shown, for example, you can use Jenkins X to orchestrate Jenkins.”

In many ways, confusion exists “almost every time you rename well-known software projects,” Torsten Volk, an analyst for Enterprise Management Associates (EMA), said. “Remember the outcry when Docker renamed the community version of its software to Moby? Here the issue was that CloudBees first came up with the Jenkins Enterprise and CloudBees Suite product names, where Jenkins Enterprise already started supporting containers,” Volk said. “Then wrapping all this mess into the CloudBees Core offering was always going to be hard, but had to be done.”

The idea now is to blend the classic Jenkins world and the Jenkins X world into one experience “so that it really doesn’t matter” if an organization, for example, were to combine Jenkins servers for serverless and automated pipelines and, for example, on-premise deployments with a single user interface (UI) and command line interface (CLI),  Strachan said. “Both of these use cases are solved since some teams are using both, right?” Strachan said. “Some teams are building new microservices but they still have that classic VM.”

Strachan did not come out and describe Jenkins X as “Jenkins 2.0.” However, the hope is that Jenkins X, following its relatively recent release, will eventually cover the bases of all Jenkins pipelines, both classic and for Kubernetes. “I think, we’ve not really gotten the message out to the community quite well enough: Jenkins X is really how everyone will use Jenkins at some point,” Strachan said.

The Use Cases

On the surface at least, arguments to adopt Jenkins X for production pipelines for Kubernetes makes obvious sense. As the Jenkins X authors define it:

“Jenkins X is a CI/CD [continuous delivery] solution for modern cloud applications on Kubernetes … Jenkins X provides pipeline automation, built-in GitOps and preview environments to help teams collaborate and accelerate their software delivery at any scale.”

For those starting a new greenfield project “and you have no CI, you just go straight to Jenkins X and that’s easy — you just automate all that stuff and you’re done,” Strachan said.

But outside of the usage sphere of cloud native-only pipelines, things can get murky — at least from the outset. It is still not readily apparent in the minds of many, for example, that Jenkins X is also designed, as mentioned before, to serve those organizations with on-premise production pipeline-only needs — whether they eventually decide to deploy to cloud native platforms or not.

Most of the organizations Strachan said he has spoken with already have Jenkins set up for pipelines and want to extend them into Jenkins X. “You could just go and say “hey, let’s just try Jenkins X to automate all of our pipelines,” Strachan said. “And it might be better for you… But really long term, we want to get rid of those Jenkins files you wrote by hand because we think our pipelines can do better.”

During the months that have followed the final production release of Jenkins X, the tools are seen as doing a good job of merging GitOps concepts and leveraging Kubernetes as the orchestration and target platform, Ravi Lachhman, a technical evangelist for AppDynamics, said. “By leveraging Kubernetes as the platform to run Jenkins X on, the CI/CD solution can be much more robust in resource placement e.g. worker nodes and availability.”

At the end of the day, “no matter what the open source platform is, each organization is different when considering build vs buy,” Lachhman said. “CloudBees provides a lot of expertise in their domain/stack and offering capabilities in scalability, security and support. For teams that are versed in GitOps, Jenkins X is a modern prescription for running a CI/CD stack on Kubernetes,”  Lachhman said. “The Jenkins family continues to evolve as the backbone of many DevOps pipelines and continues to evolve with the push into cloud native architecture.”

“CloudBees is a commercial open source software company, which writes the vast majority of Jenkins code. These sorts of structures are by no means uncommon in commercial open source,” James Governor, an analyst for and co-founder of Redmonk, said. “Jenkins is a more well-known brand than CloudBees, but again that is very common in these situations, where open source distribution gets far ahead of commercial customer acquisition.”

Strategy Revealed

CloudBees has drawn $112 million in capital since 2010 and therefore needs to reach terminal velocity sometime soon, Volk said. “They managed to sign up hundreds of paying customers for their various Jenkins support offerings, but at the same time they need to pay great talent like James Strachan who is one of the main contributors across the Jenkins and Jenkins X projects,” Volk said. “And, of course they need to support lots and lots of Jenkins integrations with every piece of infrastructure and middleware under the sun.”

The Jenkins X project was also necessary to not get behind the competitions, such as Xebia Labs, Atlassian and Electric Cloud in terms of Kubernetes support, Volk said.

“That’s why they decided to roll Jenkins, Jenkins X, Codeship, and their DevOps analytics product into one DevOps management platform that spans the whole enterprise,” Volk said. “What they now need to do is evangelize the heck out of CloudBees Core and explaining their involvement in Jenkins and Jenkins X — this is difficult.”

Source