Prometheus – transforming monitoring over the years

Today we extend our appreciation to the teams who created Prometheus, the cloud native monitoring project, and look ahead to reflect on the future of the project.

For a broad history, Prometheus is an open source project that has made significant traction in the cloud native industry and Kubernetes ecosystem. It was started at SoundCloud in 2012 by development teams that needed a tool designed to monitor and provide alerts in microservice infrastructures. Prometheus was inspired by the internal Borgmon monitoring tool at Google, similar to how Kubernetes was inspired by the internal orchestration tool Borg.

Fast forward to 2016, and the project was donated to the Cloud Native Computing Foundation (CNCF) for the benefit of the cloud native community. It reached version 1.0 in 2016, and version 2.0 in 2017.

The CoreOS team, now part of Red Hat, has invested in the project since 2016, and today, we have continued to work with Prometheus through a dedicated team of developers in order to make it consumable for the enterprise. You may recall the dedicated attention the CoreOS team has given the project over the years including upstream development, enabling it in Tectonic, and dedication to the latest v2 release. We have kept up our investment as a key part of the future of cloud native computing with Red Hat OpenShift.

Let’s walk through some of the ways we see Prometheus being very useful today in the Kubernetes ecosystem, and where we see it making an impact moving forward.

Stars are an imperfect metric, but they do give a good coarse grained measurement for the popularity of an open source project. Over the years Prometheus has grown in popularity and this metric reflects that popularity. Within the last two years it grew from 4,000 stars to 18,000 stars on GitHub; even though this is a popularity metric, it does show the rising interest in the project.

Prometheus is easy to set up as a single, statically linked binary that can be downloaded and started with a single command. In tandem with this simplicity, it scales to hundreds of thousands of samples per second ingested on modern commodity hardware. Prometheus’ architecture is well suited for dynamic environments in which containers start and stop frequently, instead of requiring manual re-configuration. We specifically re-implemented the time-series database to accommodate high churn use cases with short lived time-series, while retaining and improving query latency and resource usage.

Nearly as important as the software itself is Prometheus’ low barrier to entry into monitoring, helping to define a new era of monitoring culture. Multiple books have been written by both users as well as maintainers of Prometheus highlighting this shift towards usability, and even the new Google SRE workbook uses Prometheus in its example queries and alerts.

Moving forward, Prometheus is poised to continue widespread community development as well as at Red Hat as we seek to bring enhanced container monitoring capabilities to more users. Looking at the Kubernetes and OpenShift ecosystem, we believe Prometheus is already the de facto default solution to perform monitoring. Standardizing the efforts that have made Prometheus successful, such as the metrics format formalized through the OpenMetrics project, highlights the importance of this project in the industry.

Going forward, we believe that this standardization will be key for organizations as they seek to develop the next generation of operational tooling and culture – the bulk of which will be likely driven by Prometheus.

Learn more about Prometheus and join the community

We plan to deliver Prometheus in a future version of Red Hat OpenShift. Today you can join the community, kick the tires on the Prometheus Operator, or check out our getting started guides.

Source

Deploying a Spring Boot App with MySQL on OpenShift

This article shows how to take an existing Spring Boot standalone project that uses MySQL and deploy it on Red Hat OpenShift, In the process, we’ll create docker images which can be deployed to most container/cloud platforms. I’ll discuss creating a Dockerfile, pushing the container image to an OpenShift registry, and finally creating running pods with the Spring Boot app deployed.

To develop and test using OpenShift on my local machine, I used Red Hat Container Development Kit (CDK), which provides a single-node OpenShift cluster running in a Red Hat Enterprise Linux VM, based on minishift. You can run CDK on top of Windows, macOS, or Red Hat Enterprise Linux. For testing, I used Red Hat Enterprise Linux Workstation release 7.3. It should work on macOS too.

To create the Spring Boot app I used this article as a guide. I’m using an existing openshift/mysql-56-centos7 docker image to deploy MySQL to OpenShift.

You can download the code used in this article from my personal github repo. In this article, I’ll be building container images locally, so you’ll need to be able to build the project locally with Maven. This example exposes a rest service using: com.sample.app.MainController.java.

In the repository, you’ll find a Dockerfile in src/main/docker-files/. The dockerfile_springboot_mysql file creates a docker image, having the Spring Boot application based on java8 docker image as a base . While this is ok for testing, for production deployment you’d want to use images that are based on Red Hat Enterprise Linux.

Building the application:

1. Use mvn clean install to build the project.

2. Copy the generated jar in the target folder to src/main/docker-files. When creating the docker image, the application jar can be found at the same location.

3. Set the database username, password, and URL in src/main/resources/application.properties. Note: For OpenShift, it is recommended to pass these parameters into the container as environment variables.

Now start the CDK VM to get your local OpenShift cluster running.

1. Start the CDK VM using minishift start:

$ minishift start

2. Set your local environment for docker and the oc CLI:

$ eval $(minishift oc-env)
$ eval $(minishift docker-env)

Note: the above eval commands will not work on Windows. See the CDK documentation for more information.

3. Login to OpenShift and Docker using the developer account:

$ oc login
$ docker login -u developer -p $(oc whoami -t) $(minishift openshift registry)

Now we’ll build the container images.

1. Change the directory location to src/main/docker-files within the project. Then, execute the following commands to build the container images. Note: The period (.) is required at the end of the docker build command to indicate the current directory:

$ docker build -t springboot_mysql -f ./dockerfile_springboot_mysql .

Use the following command to view the container images that were created:

$ docker images

2. Add the tag springboot_mysql to the image, and push it to the OpenShift registry:

$ docker tag springboot_mysql $(minishift openshift registry)/myproject/springboot_mysql
$ docker push $(minishift openshift registry)/myproject/springboot_mysql

3. Next, pull the OpenShift MySQL image, and create it as an OpenShift application which will initialize and run it. Refer to the documentation for more information:

docker pull openshift/mysql-56-centos7
oc new-app -e MYSQL_USER=root -e MYSQL_PASSWORD=root -e MYSQL_DATABASE=test openshift/mysql-56-centos7

4. Wait for the pod running MySQL to be ready. You can check the status with oc get pods:

$ oc get pods
NAME READY STATUS RESTARTS AGE
mysql-56-centos7-1-nvth9 1/1 Running 0 3m

5. Next, ssh to the mysql pod and create a MySQL root user with full privileges:

$ oc rsh mysql-56-centos7-1-nvth9
sh-4.2$ mysql -u root
CREATE USER ‘root’@’%’ IDENTIFIED BY ‘root’;
Query OK, 0 rows affected (0.00 sec)

GRANT ALL PRIVILEGES ON *.* TO ‘root’@’%’ WITH GRANT OPTION;
Query OK, 0 rows affected (0.00 sec)

FLUSH PRIVILEGES;
Query OK, 0 rows affected (0.00 sec)

exit

6. Finally, initialize the Spring Boot app using imagestream springboot_mysql:

$ oc get svc
NAME CLUSTER-IP EXTERNAL-IP PORT(S) AGE
mysql-56-centos7 172.30.145.88 none 3306/TCP 8m

$ oc new-app -e spring_datasource_url=jdbc:mysql://172.30.145.88:3306/test springboot_mysql
$ oc get pods
NAME READY STATUS RESTARTS AGE
mysql-56-centos7-1-nvth9 1/1 Running 0 12m
springbootmysql-1-5ngv4 1/1 Running 0 9m

7. Check the pod logs:

oc logs -f springbootmysql-1-5ngv4

8. Next, expose the service as route:

$ oc get svc
NAME CLUSTER-IP EXTERNAL-IP PORT(S) AGE
mysql-56-centos7 172.30.242.225 none 3306/TCP 14m
springbootmysql 172.30.207.116 none 8080/TCP 1m

$ oc expose svc springbootmysql
route “springbootmysql” exposed

$ oc get route
NAME HOST/PORT PATH SERVICES PORT TERMINATION WILDCARD
springbootmysql springbootmysql-myproject.192.168.42.182.nip.io springbootmysql 8080-tcp None

9. Test the application using curl. You should see a list of all entries in the database table:

$ curl -v http://springbootmysql-myproject.192.168.42.182.nip.io/demo/all

10. Next, use curl to create an entry in the db:

$ curl http://springbootmysql-myproject.192.168.42.182.nip.io/demo/add?name=SpringBootMysqlTest
Saved

11. View the updated list of entries in the database:

$ curl http://springbootmysql-myproject.192.168.42.182.nip.io/demo/all

[{“name”:”UBUNTU 17.10 LTS”,”lastaudit”:1502409600000,”id”:1},{“name”:”RHEL 7″,”lastaudit”:1500595200000,”id”:2},{“name”:”Solaris 11″,”lastaudit”:1502582400000,”id”:3},{“name”:”SpringBootTest”,”lastaudit”:1519603200000,”id”:4},{“name”:”SpringBootMysqlTest”,”lastaudit”:1519603200000,”id”:5}

That’s it!

I hope this article is helpful to you for migrating an existing spring-boot application to OpenShift. Just a note, in production environments, one should use Red Hat Supportable Images. This document is intended for development purposes only. It should assist you in creating spring-boot applications that run in containers; and in how to set up MySQL connectivity for spring-boot in OpenShift.

Source

Fully automated canary deployments in Kubernetes

In a previous article, we described how you can do blue/green deployments in Codefresh using a declarative step in your Codefresh Pipeline.

Blue/Green deployments are very powerful when it comes to easy rollbacks, but they are not the only approach for updating your Kubernetes application.

Another deployment strategy is using Canaries (a.k.a. incremental rollouts). With canaries, the new version of the application is gradually deployed to the Kubernetes cluster while getting a very small amount of live traffic (i.e. a subset of live users are connecting to the new version while the rest are still using the previous version).

The small subset of live traffic to the new version acts as an early warning for potential problems that might be present in the new code. As our confidence increases, more canaries are created and more users are now connecting to the updated version. In the end, all live traffic goes to canaries, and thus the canary version becomes the new “production version”.

The big advantage of using canaries is that deployment issues can be detected very early while they still affect only a small subset of all application users. If something goes wrong with a canary, the production version is still present and all traffic can simply be reverted to it.

While a canary is active, you can use it for additional verification (for example running smoke tests) to further increase your confidence on the stability of each new version.

Unlike Blue/green deployments, Canary releases are based on the following assumptions:

  1. Multiple versions of your application can exist together at the same time, getting live traffic.
  2. If you don’t use some kind of sticky session mechanism, some customers might hit a production server in one request and a canary server in another.

If you cannot guarantee these two points, then blue/green deployments are a much better approach for safe deployments.

Canaries with/without Istio

The gradual confidence offered by canary releases is a major selling point and lots of organizations are looking for ways to adopt canaries for the main deployment method. Codefresh recently released a comprehensive webinar that shows how you can perform canary updates in Kubernetes using Helm and Istio.

The webinar shows the recommended way to do canaries using Istio. Istio is a service mesh that can be used in your Kubernetes cluster to shape your traffic according to your own rules. Istio is a perfect solution for doing canaries as you can point any percentage of your traffic to the canary version regardless of the number of pods that serve it.

In a Kubernetes cluster without Istio, the number of canary pods is directly affecting the traffic they get at any given point in time.

Traffic switching without IstioTraffic switching without Istio

So if for example you need your canary to get at 10% traffic, you need at least 9 production pods. With Istio there is no such restriction. The number of pods serving the canary version and the traffic they get is unrelated. All possible combinations that you might think of are valid. Here are some examples of what you can achieve with Istio:

Traffic switching with IstioTraffic switching with Istio

This is why we recommend using Istio. Istio has several other interesting capabilities such as rate limiting, circuit breakers, A/B testing etc.

The webinar also uses Helm for deployments. Helm is a package manager for Kubernetes that allows you to group multiple manifests together, allowing you to deploy an application along with its dependencies.

At Codefresh we have several customers that wanted to use Canary deployments in their pipelines but chose to wait until Istio reached 1.0 version before actually using it in production.

Even though we fully recommend Istio for doing canary deployments, we also developed a Codefresh plugin (i.e. a Docker image) that allows you to take advantage of canary deployments even on plain Kubernetes clusters (without Istio installed).

We are open-sourcing this Docker image today for everybody to use and we will explain how you can integrate it in a Codefresh pipeline with only declarative syntax.

Canary deployments with a declarative syntax

In a similar manner as the blue/green deployment plugin, the Canary plugin is also taking care of all the kubectl invocations needed behind the scenes. To use it you can simply insert it in a Codefresh pipeline as below:

canaryDeploy:

title: “Deploying new version ${}”

image: codefresh/k8s-canary:master

environment:

– WORKING_VOLUME=.

– SERVICE_NAME=my-demo-app

– DEPLOYMENT_NAME=my-demo-app

– TRAFFIC_INCREMENT=20

– NEW_VERSION=${}

– SLEEP_SECONDS=40

– NAMESPACE=canary

– KUBE_CONTEXT=myDemoAKSCluster

Notice the complete lack of kubectl commands. The Docker image k8s-canary contains a single executable that takes the following parameters as environment variables:

Environment Variable Description
KUBE_CONTEXT Name of your cluster in Codefresh dashboard
WORKING_VOLUME A folder for saving temp/debug files
SERVICE_NAME Existing K8s service
DEPLOYMENT_NAME Existing k8s deployment
TRAFFIC_INCREMENT Percentage of pods to convert to canaries at each stage
NEW_VERSION Docker tag for the next version of the app
SLEEP_SECONDS How many seconds each canary stage will wait. After that, the new pods will be checked for restarts
NAMESPACE K8s Namespace where deployments happen

Prerequisites

The canary deployments steps expect the following assumptions:

  • An initial service and the respective deployment should already exist in your cluster.
  • The name of each deployment should contain each version
  • The service should have a metadata label that shows what the “production” version is.

These requirements allow each canary deployment to finish into a state that allows the next one to run in a similar manner.

You can use anything you want as a “version”, but the recommended approach is to use GIT hashes and tag your Docker images with them. In Codefresh this is very easy because the built-in variable CF_SHORT_REVISION gives you the git hash of the commit that was pushed.

The build step of the main application that creates the Docker image that will be used in the canary step is a standard build step that tags the Docker image with the git hash.

BuildingDockerImage:

title: Building Docker Image

type: build

image_name: trivial-web

working_directory: ./example/

tag: ‘${}’

dockerfile: Dockerfile

For more details, you can look at the example application that also contains a service and deployment with the correct labels as well as the full codefresh.yml file.

How to perform Canary deployments

When you run a deployment in Codefresh, the pipeline step will print messages with its progress:

Canary LogsCanary Logs

First, the Canary plugin will read the Kubernetes services and extract the “version” metadata label to find out which version is running “in production”. Then it will read the respective deployment and find the Docker image currently getting live traffic. It will also read the number of current replicas for that deployment.

Then it will create a second deployment using the new Docker image tag. This second deployment uses the same labels as the first one, so the existing service will serve BOTH deployments at the same time. A single pod for the new version will be deployed. This pod will instantly get live traffic according to the total number of pods. For example, if you have in production 3 pods and the new version pod is created, it will instantly get 25% of the traffic (1 canary, 3 production version).

Once the first pod is created, the script is running in a loop where each iteration does the following:

  1. Increases the number of canaries according to the predefined percentage. For example, a percentage of 33% means that 3 phases of canaries will be performed. With 25%, you will see 4 canary iterations and so on. The algorithm used is pretty basic and for a very low number of pods, you will see a lot of rounding happening.
  2. Waits for some seconds until the pods have time to start (the time is configurable).
  3. Checks for pod restarts. If there are none, it assumes that everything is ok and the next iteration happens.

This goes on until only canaries get live traffic. The previous deployment is destroyed and the new one is marked as “production” in the service.

If at any point there are problems with canaries (or restarts), all canary instances are destroyed and all live traffic goes back to the production version.

You can see all this happening in real-time either using direct kubectl commands or looking at the Codefresh Kubernetes dashboard. While canaries are active you will see two docker image versions in the Images column:

We are working on more ways of health-checking in addition to looking at pod restarts. The Canary image is available in Dockerhub.

New to Codefresh? Create Your Free Account Today!

Source

Topology-Aware Volume Provisioning in Kubernetes

Topology-Aware Volume Provisioning in Kubernetes

Author: Michelle Au (Google)

The multi-zone cluster experience with persistent volumes is improving in Kubernetes 1.12 with the topology-aware dynamic provisioning beta feature. This feature allows Kubernetes to make intelligent decisions when dynamically provisioning volumes by getting scheduler input on the best place to provision a volume for a pod. In multi-zone clusters, this means that volumes will get provisioned in an appropriate zone that can run your pod, allowing you to easily deploy and scale your stateful workloads across failure domains to provide high availability and fault tolerance.

Previous challenges

Before this feature, running stateful workloads with zonal persistent disks (such as AWS ElasticBlockStore, Azure Disk, GCE PersistentDisk) in multi-zone clusters had many challenges. Dynamic provisioning was handled independently from pod scheduling, which meant that as soon as you created a PersistentVolumeClaim (PVC), a volume would get provisioned. This meant that the provisioner had no knowledge of what pods were using the volume, and any pod constraints it had that could impact scheduling.

This resulted in unschedulable pods because volumes were provisioned in zones that:

  • did not have enough CPU or memory resources to run the pod
  • conflicted with node selectors, pod affinity or anti-affinity policies
  • could not run the pod due to taints

Another common issue was that a non-StatefulSet pod using multiple persistent volumes could have each volume provisioned in a different zone, again resulting in an unschedulable pod.

Suboptimal workarounds included overprovisioning of nodes, or manual creation of volumes in the correct zones, making it difficult to dynamically deploy and scale stateful workloads.

The topology-aware dynamic provisioning feature addresses all of the above issues.

Supported Volume Types

In 1.12, the following drivers support topology-aware dynamic provisioning:

  • AWS EBS
  • Azure Disk
  • GCE PD (including Regional PD)
  • CSI (alpha) – currently only the GCE PD CSI driver has implemented topology support

Design Principles

While the initial set of supported plugins are all zonal-based, we designed this feature to adhere to the Kubernetes principle of portability across environments. Topology specification is generalized and uses a similar label-based specification like in Pod nodeSelectors and nodeAffinity. This mechanism allows you to define your own topology boundaries, such as racks in on-premise clusters, without requiring modifications to the scheduler to understand these custom topologies.

In addition, the topology information is abstracted away from the pod specification, so a pod does not need knowledge of the underlying storage system’s topology characteristics. This means that you can use the same pod specification across multiple clusters, environments, and storage systems.

Getting Started

To enable this feature, all you need to do is to create a StorageClass with volumeBindingMode set to WaitForFirstConsumer:

kind: StorageClass
apiVersion: storage.k8s.io/v1
metadata:
name: topology-aware-standard
provisioner: kubernetes.io/gce-pd
volumeBindingMode: WaitForFirstConsumer
parameters:
type: pd-standard

This new setting instructs the volume provisioner to not create a volume immediately, and instead, wait for a pod using an associated PVC to run through scheduling. Note that previous StorageClass zone and zones parameters do not need to be specified anymore, as pod policies now drive the decision of which zone to provision a volume in.

Next, create a pod and PVC with this StorageClass. This sequence is the same as before, but with a different StorageClass specified in the PVC. The following is a hypothetical example, demonstrating the capabilities of the new feature by specifying many pod constraints and scheduling policies:

  • multiple PVCs in a pod
  • nodeAffinity across a subset of zones
  • pod anti-affinity on zones

apiVersion: apps/v1
kind: StatefulSet
metadata:
name: web
spec:
serviceName: “nginx”
replicas: 2
selector:
matchLabels:
app: nginx
template:
metadata:
labels:
app: nginx
spec:
affinity:
nodeAffinity:
requiredDuringSchedulingIgnoredDuringExecution:
nodeSelectorTerms:
– matchExpressions:
– key: failure-domain.beta.kubernetes.io/zone
operator: In
values:
– us-central1-a
– us-central1-f
podAntiAffinity:
requiredDuringSchedulingIgnoredDuringExecution:
– labelSelector:
matchExpressions:
– key: app
operator: In
values:
– nginx
topologyKey: failure-domain.beta.kubernetes.io/zone
containers:
– name: nginx
image: gcr.io/google_containers/nginx-slim:0.8
ports:
– containerPort: 80
name: web
volumeMounts:
– name: www
mountPath: /usr/share/nginx/html
– name: logs
mountPath: /logs
volumeClaimTemplates:
– metadata:
name: www
spec:
accessModes: [ “ReadWriteOnce” ]
storageClassName: topology-aware-standard
resources:
requests:
storage: 10Gi
– metadata:
name: logs
spec:
accessModes: [ “ReadWriteOnce” ]
storageClassName: topology-aware-standard
resources:
requests:
storage: 1Gi

Afterwards, you can see that the volumes were provisioned in zones according to the policies set by the pod:

$ kubectl get pv -o=jsonpath='{.spec.claimRef.name}{“t”}{.metadata.labels.failure-domain.beta.kubernetes.io/zone}{“n”}’
www-web-0 us-central1-f
logs-web-0 us-central1-f
www-web-1 us-central1-a
logs-web-1 us-central1-a

How can I learn more?

Official documentation on the topology-aware dynamic provisioning feature is available here:
https://kubernetes.io/docs/concepts/storage/storage-classes/#volume-binding-mode

Documentation for CSI drivers is available at https://kubernetes-csi.github.io/docs/

What’s next?

We are actively working on improving this feature to support:

  • more volume types, including dynamic provisioning for local volumes
  • dynamic volume attachable count and capacity limits per node

How do I get involved?

If you have feedback for this feature or are interested in getting involved with the design and development, join the Kubernetes Storage Special-Interest-Group (SIG). We’re rapidly growing and always welcome new contributors.

Special thanks to all the contributors that helped bring this feature to beta, including Cheng Xing (verult), Chuqiang Li (lichuqiang), David Zhu (davidz627), Deep Debroy (ddebroy), Jan Šafránek (jsafrane), Jordan Liggitt (liggitt), Michelle Au (msau42), Pengfei Ni (feiskyer), Saad Ali (saad-ali), Tim Hockin (thockin), and Yecheng Fu (cofyc).

Source

2018 Steering Committee Election Results

2018 Steering Committee Election Results

Authors: Jorge Castro (Heptio), Ihor Dvoretskyi (CNCF), Paris Pittman (Google)

Results

The Kubernetes Steering Committee Election is now complete and the following candidates came ahead to secure two year terms that start immediately:

Big Thanks!

  • Steering Committee Member Emeritus Quinton Hoole for his service to the community over the past year. We look forward to
  • The candidates that came forward to run for election. May we always have a strong set of people who want to push community forward like yours in every election.
  • All 307 voters who cast a ballot.
  • And last but not least…Cornell University for hosting CIVS!

Get Involved with the Steering Committee

You can follow along to Steering Committee backlog items and weigh in by filing an issue or creating a PR against their repo. They meet bi-weekly on Wednesdays at 8pm UTC and regularly attend Meet Our Contributors.

Steering Committee Meetings:

Meet Our Contributors Steering AMA’s:

Source

Devops with Kubernetes | Sreenivas Makam’s Blog

September 20, 2018Containers, devops, Docker, KubernetesSreenivas Makam

I did the following presentation “Devops with Kubernetes” in Kubernetes Sri Lanka inaugural meetup earlier this week. Kubernetes is one of the most popular open source projects in the IT industry currently. Kubernetes abstractions, design patterns, integrations and extensions make it very elegant for Devops. The slides delve little deep on these topics.

Advertisements

← NEXT 100 Webinar – Top 3 reasons why you should run your enterprise workloads on GKE

Leave a Reply Cancel reply

Enter your comment here…

Fill in your details below or click an icon to log in:

Gravatar

Email (required) (Address never made public)

Name (required)

Website

WordPress.com Logo

You are commenting using your WordPress.com account.
( Log Out /
Change )

Google+ photo

You are commenting using your Google+ account.
( Log Out /
Change )

Twitter picture

You are commenting using your Twitter account.
( Log Out /
Change )

Facebook photo

You are commenting using your Facebook account.
( Log Out /
Change )

Cancel

Connecting to %s

Notify me of new comments via email.

Notify me of new posts via email.

Source

NextCloudPi upgraded to NC14.0.1 and PHP7.2 – Own your bits


The latest release of NextCloudPi is out!

This release brings the latest major version of Nextcloud, as well as an important performance boost due to the jump to PHP7.2.

Remember that we are looking at people to help us support more boards. If you own a BananaPi, OrangePi, Pine64 or any other not yet supported board talk to us. We only need some of your time to perform a quick test in the new images every few months.

We are also in need translators, more automated testing, and some web devs to take on the web interface and improve the user experience.

NextCloudPi improves everyday thanks to your feedback. Please report any problems here. Also, you can discuss anything in the forums, or hang out with us in Telegram.

Last but not least, please download through bitorrent and share it for a while to help keep hosting costs down.

Nextcloud 14.0.1

Nextcloud 14 is this yearly new major release. It comes with Video Verification, Signal/Telegram 2FA support, Improved Collaboration and GDPR compliance. See the release announcement for more details.

In order to upgrade, please use
ncp-update-nextcloud rather than the Nextcloud builtin installer. The NextCloudPi installer will save you some headaches related to missing database indices, app integrity checks and others.

Better yet, enable
ncp-autoupdate-nc and recieve Nextcloud upgrades automatically after they have been tested and verified for NCP.

PHP 7.2

Image taken from Phoronix

PHP7.2 is now fully supported by Nextcloud. This new version shows around a 25% performance increase over PHP7.0. Sweet!

nc-previews

This is a simple launcher to generate thumbnails for the Gallery app. Personal clouds are very commonly used to browse pictures and the performance of the Gallery is really bad on low end systems, because there is just no computing power available to do all the image processing for a big collection in real time as the user navigates.

The preview generator app will allow you to pre-compute this so that things go fast when you open the Gallery. This operation will use many resources, and can even take days for a Raspberry Pi with really big collections, so be aware of this.

nc-previews will scan the whole gallery on demand, generating previews where they are missing, so it best suited to be used when we first install the preview generator app in order to process the existing collection, or if somehow copy the collection externally.

Soon we will include another app that will generate only the new additions silently overnight, so they are available next time we want to browse them.

nc-prettyURL

Traditionally, NCP has decided not to apply pretty URLs, to squeeze every little performance possible from Nextcloud on low end devices. This means that the URLs look pretty ugly, because the include the index.php part.

Because we now support a variety of platforms, we decided to leave this as a configurable option.

Compare this

to this

Thanks TomTurnschuh for this contribution.


Source

Create an IoT sensor with NodeMCU and Lua

In this post I want to show you how to create your own IoT sensor with the NodeMCU and the Lua programming language. The device called the NodeMCU makes it easy to start reading sensor data, sending it back to another location for processing or aggregation, such as the cloud. We’ll also compare the NodeMCU to the Raspberry Pi and talk about the pros/cons of each for an IoT sensor.

Introduction

Picture Wikipedia Creative Commons

NodeMCU is an open source IoT platform. It includes firmware which runs on the ESP8266 Wi-Fi SoC from Espressif Systems, and hardware which is based on the ESP-12 module.

via Wikipedia

The device looks similar to an Arduino or Raspberry Pi Zero featuring a USB port for power or programming and features a dedicated chip for communicating over WiFi. Several firmwares are available (similar to an Operating System) for programming the device in Lua, C (with the Arduino IDE) or even MicroPython. Cursory reading showed the Lua firmware to support the most amount of modules/functionality including HTTP, MQTT and popular sensors such as the BME280.

The documentation for the NodeMCU with Lua is detailed and thorough giving good examples and I found it easy to work with. In my opinion the Lua language feels similar to Node.js, but may take some getting used to. Fortunately it’s easy to install Lua locally to learn about flow control, loops, functions and other constructs.

NodeMCU vs Raspberry Pi

The Raspberry Pi Zero runs a whole Operating System which is usually Linux and is capable of acting as a desktop PC, but the NodeMCU runs a firmware with a much more limited remit. A Raspberry Pi Zero can be a good basis for an IoT sensor, but also is rather over-qualified for the task. The possibilities it brings come at a cost, such as relatively high power consumption and unreliable flash storage, which can become corrupted over time.

Its power consumption with WiFi enabled could be anything up to 120 mA even with HDMI and LEDs disabled. In contrast the NodeMCU runs a much more specialised chip with power-saving features such as a deep sleep mode that can make the board run for up to a year with a standard 2500mAh LiPo battery.

Here’s my take:

I’m a big fan of the Raspberry Pi and own more than anyone else I know (maybe you have more?), but it does need maintenance such as OS upgrades, package updates and the configuration to set up I2c or similar can be time-consuming. For IoT sensors, if you are willing to learn some Lua the NodeMCU can send readings over HTTP or MQTT and is low-powered and low hassle at the same time.

If you already have a Raspberry Pi and can’t wait to get your NodeMCU then you can follow my tutorial with InfluxDB here.

yep, saw your @pimoroni EnviroPhat piece and thought it was Grafana to start with-this is my version pic.twitter.com/YlRjuLMfBk

— Alex Ellis (@alexellisuk) 2 September 2016

Tutorial overview

  • Bill of materials
  • Create a firmware
  • Flash firmware to NodeMCU
  • Test the REPL
  • Connect to WiFi
  • Connect and test the BME280 sensor
  • Upload init.lua
  • Upload sensor readings to MQTT
  • Observe reported MQTT readings on PC/Laptop

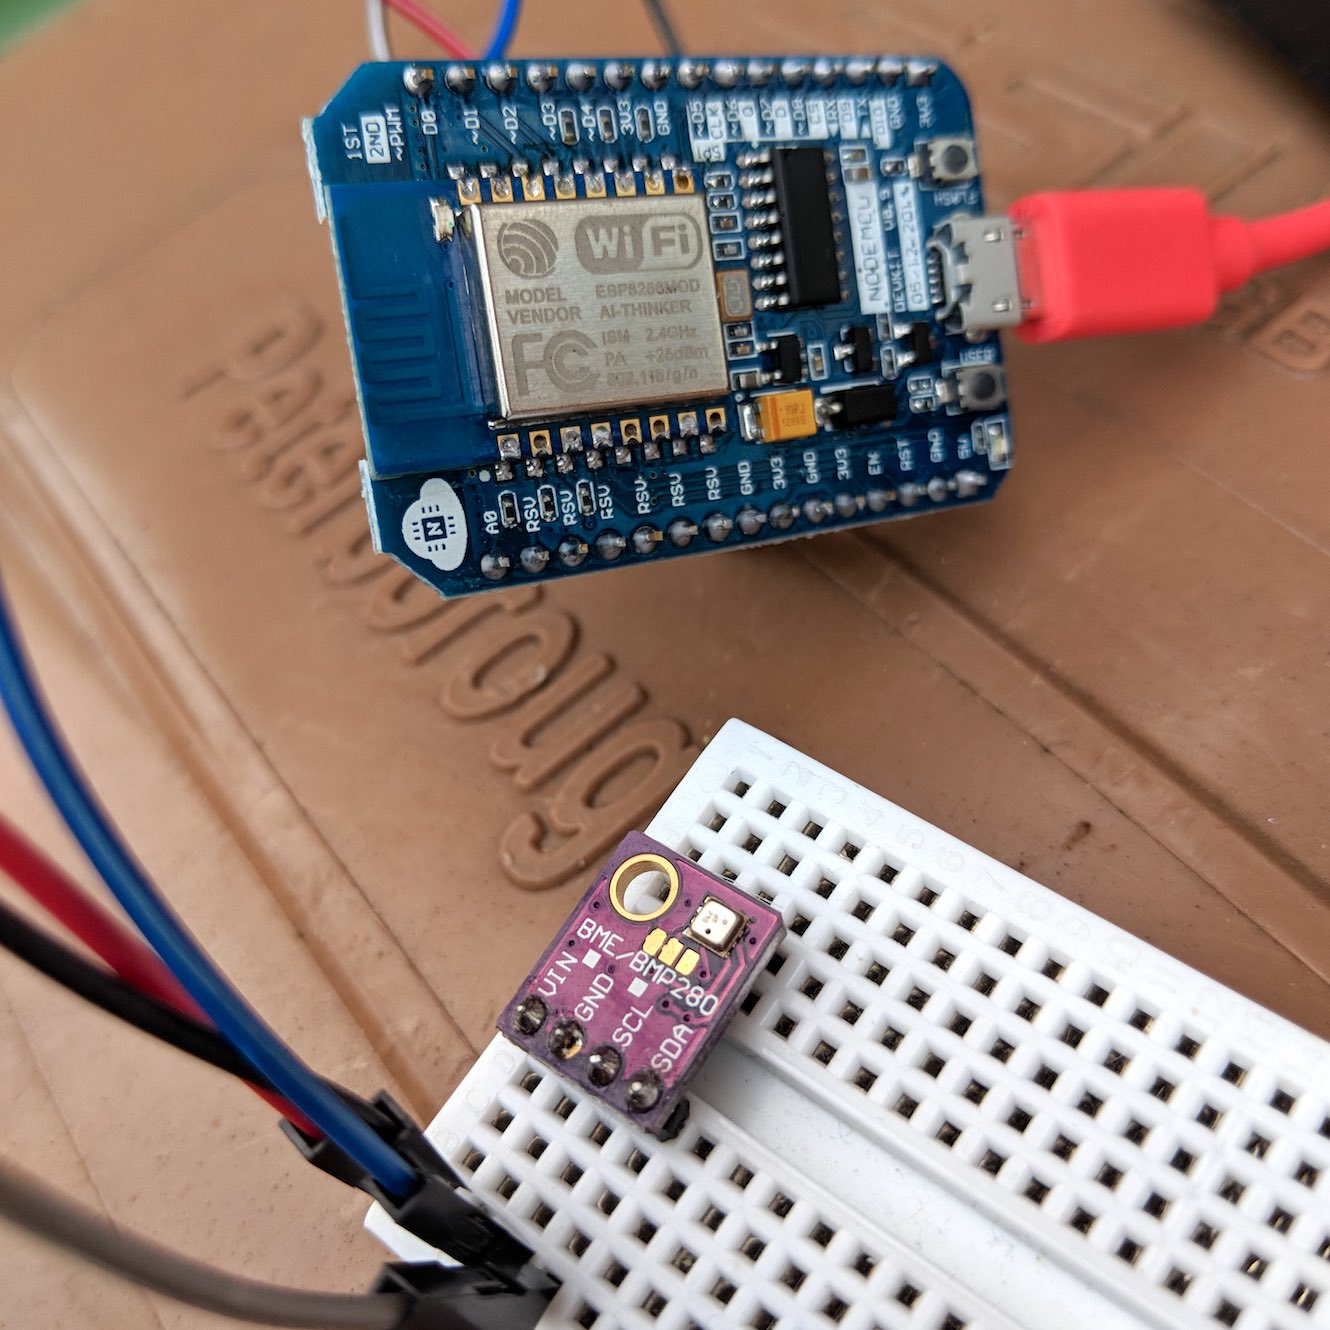
The finished IoT sensor:

mcu_setup

Bill of materials

  • NodeMCU

You will need to purchase a NodeMCU board. I recommend buying that on eBay, with pre-soldered pins. Aim to spend 4-6 USD.

I buy these for 3-5 USD on eBay, branded versions are much more expensive.

  • Short male-to-male and male-to-female jumpers
  • Small bread-board

Create a firmware

The NodeMCU chip is capable of supporting dozens of different firmware modules, but has limited space, so we will create a firmware using a free cloud service and then upload to the chip.

  • Head over to https://nodemcu-build.com/
  • Select the stable 1.5 firmware version
  • Pick the following modules: adc, bme280, cjson, file, gpio, http, i2c, mqtt, net, node pwm, tmr, uart, wifi.

You will receive an email with a link to download the firmware.

Flash the firmware

You will need to install a Python script to flash the firmware over the USB serial port. There are various options available and I used esptool.py on a Linux box.

https://nodemcu.readthedocs.io/en/master/en/flash/

This means I typed in:

$ sudo ./esptool/esptool.py -p /dev/ttyUSB0 write_flash 0x00000 nodemcu-1.5.4.1-final-15-modules-2018-07-01-20-30-09-float.bin

final-12-modules-2018-07-01-19-38-04-float.bin
esptool.py v2.4.1
Serial port /dev/ttyUSB0
Connecting….
Detecting chip type… ESP8266
Chip is ESP8266EX
Features: WiFi
MAC: 18:fe:34:a2:8b:0d
Uploading stub…
Running stub…
Stub running…
Configuring flash size…
Auto-detected Flash size: 4MB
Flash params set to 0x0040
Compressed 480100 bytes to 313202…
Wrote 480100 bytes (313202 compressed) at 0x00000000 in 27.6 seconds (effective 139.0 kbit/s)…
Hash of data verified.

Leaving…
Hard resetting via RTS pin…

Test the REPL

Now that the NodeMCU has the Lua firmware flashed you can connect with Linux or Mac to the device in a terminal to enter commands on the REPL.

The device starts off at a baud rate of 115200 which is not useable for typing.

sudo screen -L /dev/ttyUSB0 115200

> uart.setup(0,9600,8,0,1,1)

Now type in Control + A + : then type in quit

Next you can connect at the lower speed and try out a few commands from the docs.

sudo screen -L /dev/ttyUSB0 9600

> print(“Hello world”)
Hello world
>

Keep the screen session open, you can suspend it at any time by typing Control A + D and resume with screen -r.

Connect to WiFi

Next let’s try to connect to the WiFi network and get an I.P. address so that we can access the web.

ssid=”SSID”
key=”key”

wifi.setmode(wifi.STATION)
wifi.sta.config(ssid, key)
wifi.sta.connect()
tmr.delay(1000000)

print(string.format(“IP: %s”,wifi.sta.getip()))

IP: 192.168.0.52

Now that you have the device IP you should be able to ping it with ping -c 3 192.168.0.52

Since we built-in the HTTP stack we can now access a web-page.

Go to https://requestbin.fullcontact.com/ and create a “Request Bin”

Now type in the code below changing the URL to the one provided to you by the website. When you refresh the web-page, you should see the data appear on the page showing the WiFi signal “RSSI”.

binURL=”http://requestbin.fullcontact.com/13651yq1″
http.post(binURL,
‘Content-Type: application/json’,
string.format(‘{“rssi”: %d}’, wifi.sta.getrssi()),
function(code, data)
if (code < 0) then
print(“HTTP request failed”)
else
print(code, data)
end
end)

In my example I saw the data {“rssi”: -64} appear on the UI showing a good/low noise level due to proximity to my access point.

Connect and test the BME280 sensor

According to mqtt.org, MQTT is:

.. a machine-to-machine (M2M)/”Internet of Things” connectivity protocol. It was designed as an extremely lightweight publish/subscribe messaging transport. It is useful for connections with remote locations where a small code footprint is required and/or network bandwidth is at a premium.

If you’ve ever used a message queue before then this will be familiar territory, but if it’s new then you can either publish messages or subscribe to them for a given topic.

Example: a base station subscribes to a topic called “sensor-readings” and a series of NodeMCU / IoT devices publish sensor readings to the “sensor-readings” topic. This de-couples the base-station/receiver from the IoT devices which broadcast their sensor readings as they become available.

We can use the public Mosquitto test MQTT server called test.mosquitto.com – all readings will be publicly available, but you can run your own Mosquitto MQTT server with Docker or Linux later on.

Now power off the device by unplugging the USB cable and connect the BME280 sensor.

I suggest making all these connections via the breadboard, but you could also connect them directly:

  • Connect positive on the BME280 to 3v3 on the NodeMCU
  • Connect GND on the BME280 to GND on the NodeMCU
  • Connect SDA on the BME280 to to pin D3 on the NodeMCU
  • Connect SDC on the BME280 to to pin D3 on the NodeMCU

Now power up and get into 9600 baud again, opening the screen and REPL so we can test the sensor.

sda, scl = 3, 4
mode = bme280.init(sda, scl)
print(mode)
tmr.delay(1000000)
H, T = bme280.humi()
t = T / 100
h = H / 1000
ip = wifi.sta.getip()
if ip == nil then
ip = “127.0.0.1”
end
RSSI=wifi.sta.getrssi()
if RSSI == nil then
RSSI=-1
end

msg = string.format(‘{“sensor”: “s1”, “humidity”: “%.2f”, “temp”: “%.3f”, “ip”: “%s”, “rssi”: %d}’, h, t, ip, RSSI)
print(msg)

If the connections were made correctly then you will now see a JSON message on the console.

Upload init.lua

Download init.lua from my GitHub Gist and then update the WiFi SSID (mySsid) and Password settings (myKey).

https://gist.github.com/alexellis/6a4309b316a1bc650e212d6d4f47deea

Find a compatible tool to upload the init.lua file, or on Linux use the same tool I used:

sudo nodemcu-uploader –port=/dev/ttyUSB0 upload ./init.lua

Various tools are available to upload code: https://nodemcu.readthedocs.io/en/dev/en/upload/

Upload sensor readings to MQTT

Now unplug your NodeMCU and find a small USB power pack or phone charger and plug the device in. It will run init.lua and start transmitting messages to test.mosquitto.com over MQTT.

Observe reported MQTT readings on PC/Laptop

Install an MQTT client on Linux or find a desktop application for MacOS/Windows.

On Debian/Ubuntu/RPi you can run: sudo apt-get install mosquitto-clients

Then listen to the server on the topic “sensor-readings”:

mosquitto_sub -h test.mosquitto.org -p 1883 -t sensor-readings -d

Example of data coming in from my sensor in my garden:

Subscribed (mid: 1): 0

Client mosqsub/19950-alexellis received PUBLISH (d0, q0, r0, m0, ‘sensor-readings’, … (108 bytes))
{“sensor”: “s1”, “humidity”: “58.38”, “temp”: “24.730”, “ip”: “192.168.0.51”, “vdd33”: “65535”, “rssi”: -75}
Client mosqsub/19950-alexellis received PUBLISH (d0, q0, r0, m0, ‘sensor-readings’, … (108 bytes))
{“sensor”: “s1”, “humidity”: “57.96”, “temp”: “24.950”, “ip”: “192.168.0.51”, “vdd33”: “65535”, “rssi”: -75}

Wrapping up

You’ve now built a robust IoT sensor that can connect over your WiFi network to broadcast sensor readings around the world.

Take it further by trying some of these ideas:

  • Add WiFi re-connection code
  • Use deep sleep to save power between readings
  • Aggregate the readings in a time-series database, or CSV file for plotting charts – try my environmental monitoring dashboard
  • Run your own MQTT server/broker
  • Try another sensor such as an LDR to measure light
  • Build an external enclosure and run the device in your garden

If you liked this tutorial or have questions then follow me @alexellisuk on Twitter.

Create an IoT environmental sensor with NodeMCU and Lua https://t.co/esgaeqrKwq pic.twitter.com/hm7sWIi3AF

— Alex Ellis (@alexellisuk) July 9, 2018

Source

Java comes to the official OpenFaaS templates

At the core of OpenFaaS is a community which is trying to Make Serverless Functions Simple for Docker and Kubernetes. In this blog post I want to show you the new Java template released today which brings Serverless functions to Java developers.

If you’re not familiar with the OpenFaaS CLI, it is used to generate new files with everything you need to start building functions in your favourite programming language.

The new template made available today provides Java 9 using the OpenJDK, Alpine Linux and gradle as a build system. The serverless runtimes for OpenFaaS uses the new accelerated watchdog built out in the OpenFaaS Incubator organisation on GitHub.

Quickstart

First of all, set up OpenFaaS on your laptop or the cloud with Kubernetes or Docker Swarm. Follow the quickstart here

Checklist:

  • I have my API Gateway URL
  • I’ve installed the faas-cli
  • I have Docker installed
  • I have a Docker Hub account or similar local Docker registry available

I recommend using Visual Studio Code to edit your Java functions. You can also install the Java Extension Pack from Microsoft.

Generate a Java function

You can pull templates from any supported GitHub repository, this means that teams can build their own templates for golden Linux images needed for compliance in the enterprise.

$ faas-cli template pull

You can list all the templates you’ve downloaded like this:

$ faas-cli new –list


java8

Tip: Before we get started, sign up for a Docker Hub accout, or log into your own local Docker registry.

Below update username=alexellis2 to your Docker Hub user name or private registry address. Now generate a new Java function using the faas-cli which you should have installed.

export username=alexellis2

mkdir -p blog
cd blog

faas-cli new –lang java8 hello-java –prefix=$username

This generates several files:

  • build.gradle – specify any other JAR files or code repositories needed
  • settings.gradle – specify any other build settings needed

You then get a function Handler.java and HandlerTest.java file in the ./src folder.

package com.openfaas.function;

import com.openfaas.model.IHandler;
import com.openfaas.model.IResponse;
import com.openfaas.model.IRequest;
import com.openfaas.model.Response;

public class Handler implements com.openfaas.model.IHandler {

public IResponse Handle(IRequest req) {
Response res = new Response();
res.setBody(“Hello, world!”);

return res;
}
}

Contents of ./hello-java/src/main/java/com/openfaas/function/Handler.java

Build and deploy the function

Now use the faas-cli to build the function, you will see gradle kick in and start downloading the dependencies it needs:

faas-cli build -f hello-java.yml

If you are running on Kubernetes, then you may need to pass the –gateway flag with the URL you used for the OpenFaaS portal. You can also set this in the OPENFAAS_URL environmental-variable.

faas-cli deploy -f hello-java.yml –gateway 127.0.0.1:31112

Test the function

You can now test the function via the OpenFaaS UI portal, using Postman, the CLI or even curl.

export OPENFAAS_URL=http://127.0.0.1:31112/

echo -n “” | faas-cli invoke hello-java

Add a third-party dependency

You can now add a third-party dependency such as okhttp which is a popular and easy to use HTTP client. We will create a very rudimentary HTTP proxy which simply fetches the text of any URL passed in via the request.

  • Scaffold a new template

$ faas-cli new –lang java8 web-proxy

  • Edit build.gradle

At the end of the dependencies { add the following:

implementation ‘com.squareup.okhttp3:okhttp:3.10.0’
implementation ‘com.squareup.okio:okio:1.14.1’

  • Edit Handler.java

Paste the following into your Handler.java file, this imports the OKHttpClient into scope.

package com.openfaas.function;

import com.openfaas.model.IHandler;
import com.openfaas.model.IResponse;
import com.openfaas.model.IRequest;
import com.openfaas.model.Response;

import java.io.IOException;

import okhttp3.OkHttpClient;

public class Handler implements IHandler {

public IResponse Handle(IRequest req) {
IResponse res = new Response();

try {
OkHttpClient client = new OkHttpClient();

okhttp3.Request request = new okhttp3.Request.Builder()
.url(req.getBody())
.build();

okhttp3.Response response = client.newCall(request).execute();
String ret = response.body().string();
res.setBody(ret);

} catch(Exception e) {
e.printStackTrace();
res.setBody(e.toString());
}

return res;
}
}

  • Package, deploy and test

faas-cli build -f web-proxy.yml
faas-cli push -f web-proxy.yml
faas-cli deploy -f web-proxy.yml

Now test it out with a JSON endpoint returning the position of the International Space Station.

$ echo -n “http://api.open-notify.org/iss-now.json” | faas-cli invoke web-proxy

Parse a JSON request

You can use your preferred JSON library to parse a request in JSON format. This example uses Google’s GSON library and loads a JSON request into a Java POJO.

  • Create a function

faas-cli new –lang java8 buildinfo

  • Edit build.gradle

Within dependencies add:

implementation ‘com.google.code.gson:gson:2.8.5’

  • Edit Handler.java

package com.openfaas.function;

import com.openfaas.model.IHandler;
import com.openfaas.model.IResponse;
import com.openfaas.model.IRequest;
import com.openfaas.model.Response;

import com.google.gson.*;

public class Handler implements com.openfaas.model.IHandler {

public IResponse Handle(IRequest req) {
Response res = new Response();

Gson gson = new Gson();
BuildInfo buildInfo = gson.fromJson(req.getBody(), BuildInfo.class);

res.setBody(“The status of the build is: ” + buildInfo.getStatus());

return res;
}
}

class BuildInfo {
private String status = “”;
public String getStatus() { return this.status; }
}

Build, push and deploy your function.

Now invoke it via the CLI:

$ echo ‘{“status”: “queued”}’ | faas invoke buildinfo
The status of the build is: queued

Donwload and parse JSON from an URL

In this example I will show you how to fetch the manifest file from the OpenFaaS Function Store, we will then deserialize it into an ArrayList and print out the count.

  • Create a function named deserialize

  • Edit build.gradle

Within dependencies add:

implementation ‘com.google.code.gson:gson:2.8.5’
implementation ‘com.squareup.okhttp3:okhttp:3.10.0’
implementation ‘com.squareup.okio:okio:1.14.1’

  • Handler.java

package com.openfaas.function;

import com.openfaas.model.IHandler;
import com.openfaas.model.IResponse;
import com.openfaas.model.IRequest;
import com.openfaas.model.Response;

import com.google.gson.*;
import okhttp3.OkHttpClient;
import com.google.gson.reflect.TypeToken;
import java.util.ArrayList;

public class Handler implements com.openfaas.model.IHandler {

public IResponse Handle(IRequest req) {
Response res = new Response();

Gson gson = new Gson();
String url = “https://raw.githubusercontent.com/openfaas/store/master/store.json”;
ArrayList<Function> functions = (ArrayList<Function>) gson.fromJson(downloadFromURL(url), new TypeToken<ArrayList<Function>>(){}.getType());

int size = functions.size();
String functionCount = Integer.toString(size);
res.setBody(functionCount +” function(s) in the OpenFaaS Function Store”);
return res;
}

public String downloadFromURL(String url) {
String ret = “{}”;

try {
OkHttpClient client = new OkHttpClient();
okhttp3.Request request = new okhttp3.Request.Builder()
.url(url)
.build();

okhttp3.Response response = client.newCall(request).execute();
ret = response.body().string();
} catch(Exception e) {
e.printStackTrace();
System.out.println(e.toString());
}
return ret;
}
}

class Function {
public String Name = “”;
}

Here is the output:

$ echo | faas-cli invoke deserialize ; echo
16 function(s) in the OpenFaaS Function Store

Wrapping up

We have now packaged and deployed a Serverless function written in Java. The new OpenFaaS watchdog component keeps your function hot and that ensures the JVM is re-used between invocations. This approach enables high-throughput for your code.

Let us know what you think of the new Java template by tweeting to @openfaas or join the Slack community for one of the special-interest channels like #kubernetes or #templates.

Take it further

If you would like to use some other JDK version, a different base-image for the Linux container or even a different build-tool like Maven, you can fork the templates repository and add your own variant.

Contributions are welcome, so if you have an enhancement that will benefit the community, please feel free to suggest it over on GitHub.

The Java 8 + Gradle 4.8.1 template is available here:

https://github.com/openfaas/templates/tree/master/template/java8

Source

Eclipse Che 6.6 Release Notes

[This article is cross-posted from the Eclipse Che Blog.]

Eclipse Che 6.6 is here! Since the release of Che 6.0, the community has added a number of new capabilities:

  • Kubernetes support: Run Che on Kubernetes and deploy it using Helm.
  • Hot server updates: Upgrade Che with zero downtime.
  • C/C++ support: ClangD Language Server was added.
  • Camel LS support: Apache Camel Language Server Protocol (LSP) support was added.
  • <strong”>Eclipse Java Development Tools (JDT) Language Server (LS): Extended LS capabilities were added for Eclipse Che.
  • Faster workspace loading: Images are pulled in parallel with the new UI.

Quick Start

Che is a cloud IDE and containerized workspace server. You can get started with Che by using the following links:

Kubernetes Support (#8559)

In the past, Eclipse Che was primarily targeted at Docker. However, with the rise of Kubernetes, we have added OpenShift and native Kubernetes as primary deployment platforms.

Since the 6.0.0 release, we have made a number of changes to ensure that Che works with Kubernetes. These changes were related to volume management for workspaces, routing, service creation, and more.

We have also recently added Helm charts for deploying Che on Kubernetes. Helm is a popular application template system for deploying container applications on Kubernetes. Helm charts were first included in the 6.2.0 release, and support has improved through the 6.3.0 and 6.4.0 releases.

Much of the work to support TLS routes and multiuser Che deployments using Helm was contributed by Guy Daich from SAP. Thank you, Guy!

Learn more about Che on Kubernetes in the documentation.

Highlighted Issues

See the following pull requests (PRs):

  • Kubernetes-infra: routing, TLS (rebased) #9329
  • Use templates only to deploy Che to OpenShift #9190
  • Kubernetes multiuser helm #8973
  • Kubernetes-infra: server routing strategies and basic TLS kind/enhancement status/code-review #8822
  • Initial support for deploying Che to Kubernetes using Helm charts #8715
  • Added Kubernetes infrastructure #8559

Hot Server Updates (#8547)

In recent releases, we steadily improved the ability to upgrade the Che server without having to stop or restart active workspaces. In Che 6.6.0, it is now possible to upgrade the Che server with no downtime for active workspaces, and there is only a short period when you cannot start new workspaces. This was a request from our enterprise users, but it helps teams of all sizes.

You can learn more in the documentation.

Highlighted Issues

See the following PRs:

  • Implement interruption of start for OpenShift workspaces #5918
  • Implement recovery for OpenShift infrastructure #5919
  • Server checkers won’t be started if a workspace is started by another Che Server instance #9502
  • Document procedure of rolling hot update #9630
  • Adapt ServiceTermination functionality to workspaces recovering #9317
  • Server checkers works incorrectly when k8s/os workspaces are recovered #9453
  • Add an ability to use distributed cache for storing workspace statuses in WorkspaceRuntimes #9206
  • Do not use data volume to store agents on OpenShift/Kubernetes #9040

C/C++ Support with ClangD LS (#7516)

Clang provides a C and C++ language front end for the LLVM compiler suite, and the Clangd LS enables improved support for the C language in Eclipse Che and other LSP-capable IDEs. Many thanks to Hanno Kolvenbach from Silexica for the contribution of this feature.

Code Completion with ClangD

Go to Definition with ClangD

Apache Camel LSP Support (#8648)

Camel-language-server is a server implementation that provides Camel DSL intelligence. The server adheres to the Language Server Protocol and has been integrated into Eclipse Che. The server utilizes Apache Camel.

Related PRs

See the following PRs:

  • Introduce Apache Camel LSP support #8648
  • [533196] Fix Camel LSP artefact to download #9324

Eclipse JDT LS (#6157)

The Eclipse JDT LS combines the power of the Eclipse JDT (that powers the Eclipse desktop IDE) with the Language Server Protocol. The JDT LS can be used with any editor that supports the protocol, including Che of course. The server is based on:

  • Eclipse LSP4J, the Java binding for LSP
  • Eclipse JDT, which provides Java support (code completion, references, diagnostics, and so on) in Eclipse IDE
  • M2Eclipse, which provides Maven support
  • Buildship, which provides Gradle support

Eclipse Che will soon switch its Java support to use the JDT LS. In order to support this transition, we’ve been working hard on supporting extended LS capabilities. Java is one of the most used languages by Che users, and we are going to bring even more capabilities thanks to the JDT LS. Once the switch is done, you can expect more Java versions to be supported, as well as Maven and Gradle support!

Highlighted Issues

See the following PRs:

Faster Workspace Loading (#8748)

In version 6.2.0, we introduced the ability for Che to pull multiple images in parallel through the SPI. This way, when you are working on a multi-container based application, your workspace’s container images are instantiated more quickly.

Highlighted Issues

See the following PR:

  • Che should pull images in parallel (#7102)

Coming Soon

You can keep track of our future plans for Eclipse Che on the project roadmap page. In coming releases, you can expect further improvements to the extensibility of the platform, including an Eclipse Che plugins framework, support for a debug adapter protocol to improve debugging capabilities in the IDE, integration of more cloud-native technologies into workspace management, and scalability and reliability work to make Eclipse Che even more suitable for large enterprise users.

The community is working hard on those different aspects, and we will be speaking about this more extensively in the following weeks. If you are interested in learning more and want to eventually engage, don’t forget to join the bi-weekly community call.

Getting Started

Get started on Kubernetes, OpenShift, or Docker.

Learn more in our documentation and start using a shared Che server or a local instance today.

The Eclipse Che project is always looking for user feedback and new contributors! Find out how you can get involved and help make Che even better.

Source