Support for Azure VMSS, Cluster-Autoscaler and User Assigned Identity


Support for Azure VMSS, Cluster-Autoscaler and User Assigned Identity

Author: Krishnakumar R (KK) (Microsoft), Pengfei Ni (Microsoft)

Introduction

With Kubernetes v1.12, Azure virtual machine scale sets (VMSS) and cluster-autoscaler have reached their General Availability (GA) and User Assigned Identity is available as a preview feature.

Azure VMSS allow you to create and manage identical, load balanced VMs that automatically increase or decrease based on demand or a set schedule. This enables you to easily manage and scale multiple VMs to provide high availability and application resiliency, ideal for large-scale applications like container workloads [1].

Cluster autoscaler allows you to adjust the size of the Kubernetes clusters based on the load conditions automatically.

Another exciting feature which v1.12 brings to the table is the ability to use User Assigned Identities with Kubernetes clusters [12].

In this article, we will do a brief overview of VMSS, cluster autoscaler and user assigned identity features on Azure.

VMSS

Azure’s Virtual Machine Scale sets (VMSS) feature offers users an ability to automatically create VMs from a single central configuration, provide load balancing via L4 and L7 load balancing, provide a path to use availability zones for high availability, provides large-scale VM instances et. al.

VMSS consists of a group of virtual machines, which are identical and can be managed and configured at a group level. More details of this feature in Azure itself can be found at the following link [1].

With Kubernetes v1.12 customers can create k8s cluster out of VMSS instances and utilize VMSS features.

Cluster components on Azure

Generally, standalone Kubernetes cluster in Azure consists of the following parts

  • Compute – the VM itself and its properties.
  • Networking – this includes the IPs and load balancers.
  • Storage – the disks which are associated with the VMs.

Compute

Compute in cloud k8s cluster consists of the VMs. These VMs are created by provisioning tools such as acs-engine or AKS (in case of managed service). Eventually, they run various system daemons such as kubelet, kube-api server etc. either as a process (in some versions) or as a docker container.

Networking

In Azure Kubernetes cluster various networking components are brought together to provide features required for users. Typically they consist of the network interfaces, network security groups, public IP resource, VNET (virtual networks), load balancers etc.

Storage

Kubernetes clusters are built on top of disks created in Azure. In a typical configuration, we have managed disks which are used to hold the regular OS images and a separate disk is used for etcd.

Cloud provider components

Kubernetes cloud provider interface provides interactions with clouds for managing cloud-specific resources, e.g. public IPs and routes. A good overview of these components is given in [2]. In case of Azure Kubernetes cluster, the Kubernetes interactions go through the Azure cloud provider layer and contact the various services running in the cloud.

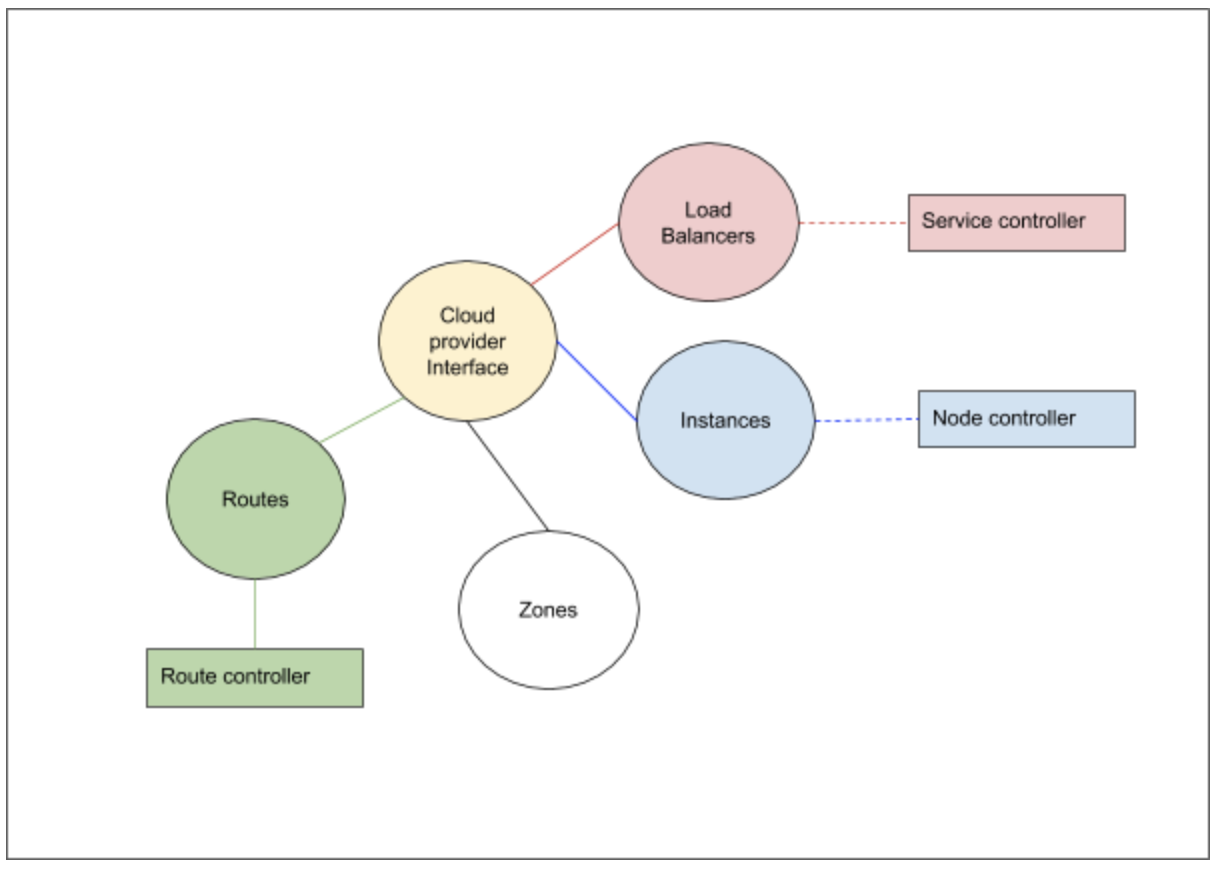
The cloud provider implementation of K8s can be largely divided into the following component interfaces which we need to implement:

  1. Load Balancer
  2. Instances
  3. Zones
  4. Routes

In addition to the above interfaces, the storage services from the cloud provider is linked via the volume plugin layer.

Azure cloud provider implementation and VMSS

In the Azure cloud provider, for every type of cluster we implement, there is a VMType option which we specify. In case of VMSS, the VM type is “vmss”. The provisioning software (acs-engine, in future AKS etc.) would setup these values in /etc/kubernetes/azure.json file. Based on this type, various implementations would get instantiated [3]

The load balancer interface provides access to the underlying cloud provider load balancer service. The information about the load balancers and the control operations on them are required for Kubernetes to handle the services which gets hosted on the Kubernetes cluster. For VMSS support the changes ensure that the VMSS instances are part of the load balancer pool as required.

The instances interfaces help the cloud controller to get various details about a node from the cloud provider layer. For example, the details of a node like the IP address, the instance id etc, is obtained by the controller by means of the instances interfaces which the cloud provider layer registers with it. In case of VMSS support, we talk to VMSS service to gather information regarding the instances.

The zones interfaces help the cloud controller to get zone information for each node. Scheduler could spread pods to different availability zones with such information. It is also required for supporting topology aware dynamic provisioning features, e.g. AzureDisk. Each VMSS instances will be labeled with its current zone and region.

The routes interfaces help the cloud controller to setup advanced routes for Pod network. For example, a route with prefix node’s podCIDR and next hop node’s internal IP will be set for each node. In case of VMSS support, the next hops are VMSS virtual machines’ internal IP address.

The Azure volume plugin interfaces have been modified for VMSS to work properly. For example, the attach/detach to the AzureDisk have been modified to perform these operations at VMSS instance level.

Setting up a VMSS cluster on Azure

The following link [4] provides an example of acs-engine to create a Kubernetes cluster.

acs-engine deploy –subscription-id <subscription id>
–dns-prefix <dns> –location <location>
–api-model examples/kubernetes.json

API model file provides various configurations which acs-engine uses to create a cluster. The API model here [5] gives a good starting configuration to setup the VMSS cluster.

Once a VMSS cluster is created, here are some of the steps you can run to understand more about the cluster setup. Here is the output of kubectl get nodes from a cluster created using the above command:

$ kubectl get nodes
NAME STATUS ROLES AGE VERSION
k8s-agentpool1-92998111-vmss000000 Ready agent 1h v1.12.0-rc.2
k8s-agentpool1-92998111-vmss000001 Ready agent 1h v1.12.0-rc.2
k8s-master-92998111-0 Ready master 1h v1.12.0-rc.2

This cluster consists of two worker nodes and one master. Now how do we check which node is which in Azure parlance? In VMSS listing, we can see a single VMSS:

$ az vmss list -o table -g k8sblogkk1
Name ResourceGroup Location Zones Capacity Overprovision UpgradePolicy
—————————- ————— ———- ——- ———- ————— —————
k8s-agentpool1-92998111-vmss k8sblogkk1 westus2 2 False Manual

The nodes which we see as agents (in the kubectl get nodes command) are part of this vmss. We can use the following command to list the instances which are part of the VM scale set:

$ az vmss list-instances -g k8sblogkk1 -n k8s-agentpool1-92998111-vmss -o table
InstanceId LatestModelApplied Location Name ProvisioningState ResourceGroup VmId
———— ——————– ———- —————————— ——————- ————— ————————————
0 True westus2 k8s-agentpool1-92998111-vmss_0 Succeeded K8SBLOGKK1 21c57d6c-9c8f-4a62-970f-63ed0fcba53f
1 True westus2 k8s-agentpool1-92998111-vmss_1 Succeeded K8SBLOGKK1 840743b9-0076-4a2e-920e-5ba9da296665

The node name does not match the name in the vm scale set, but if we run the following command to list the providerID we can find the matching node which resembles the instance name:

$ kubectl describe nodes k8s-agentpool1-92998111-vmss000000| grep ProviderID
ProviderID: azure:///subscriptions/<subscription id>/resourceGroups/k8sblogkk1/providers/Microsoft.Compute/virtualMachineScaleSets/k8s-agentpool1-92998111-vmss/virtualMachines/0

Current Status and Future

Currently the following is supported:

  1. VMSS master nodes and worker nodes
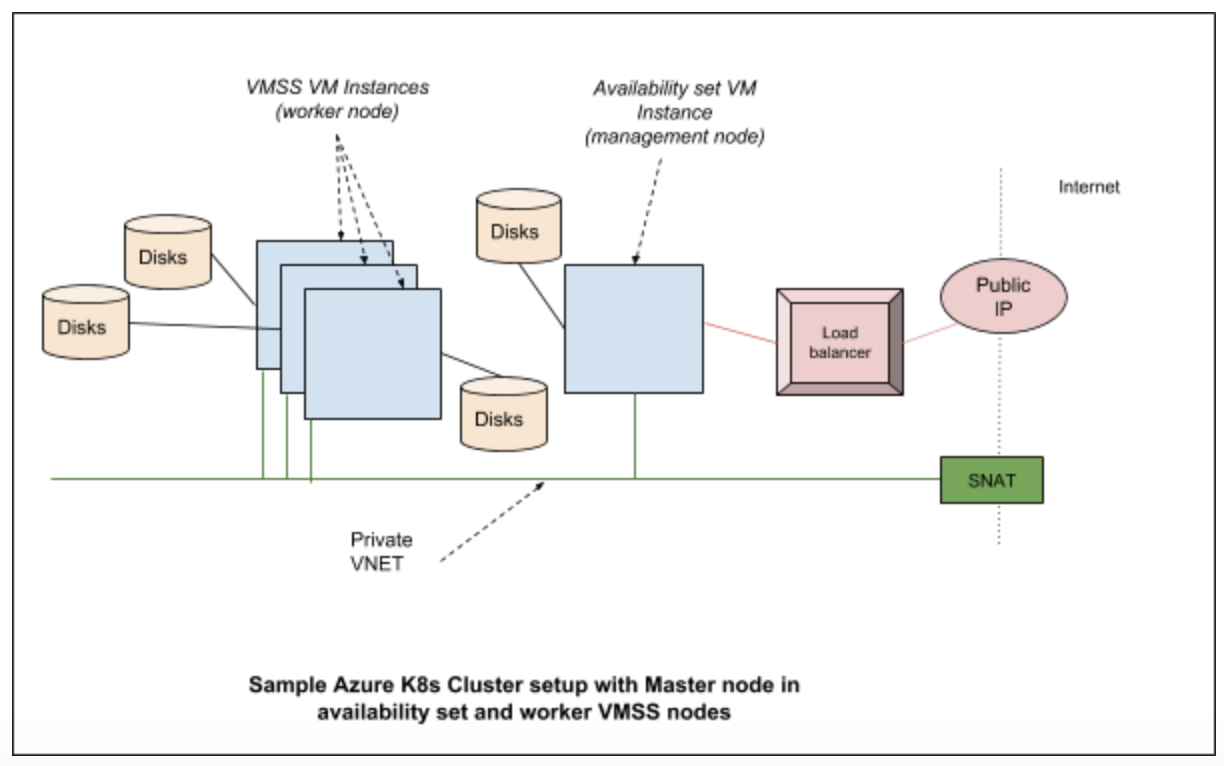
  2. VMSS on worker nodes and Availability set on master nodes combination.
  3. Per vm disk attach
  4. Azure Disk & Azure File support
  5. Availability zones (Alpha)

In future there will be support for the following:

  1. AKS with VMSS support
  2. Per VM instance public IP

Cluster Autoscaler

A Kubernetes cluster consists of nodes. These nodes can be virtual machines, bare metal servers or could be even virtual node (virtual kubelet). To avoid getting lost in permutations and combinations of Kubernetes ecosystem ;-), let’s consider that the cluster we are discussing consists of virtual machines, which are hosted in a cloud (eg: Azure, Google or AWS). What this effectively means is that you have access to virtual machines which run Kubernetes agents and a master node which runs k8s services like API server. A detailed version of k8s architecture can be found here [11].

The number of nodes which are required on a cluster depends on the workload on the cluster. When the load goes up there is a need to increase the nodes and when it subsides, there is a need to reduce the nodes and clean up the resources which are no longer in use. One way this can be taken care of is to manually scale up the nodes which are part of the Kubernetes cluster and manually scale down when the demand reduces. But shouldn’t this be done automatically ? Answer to this question is the Cluster Autoscaler (CA).

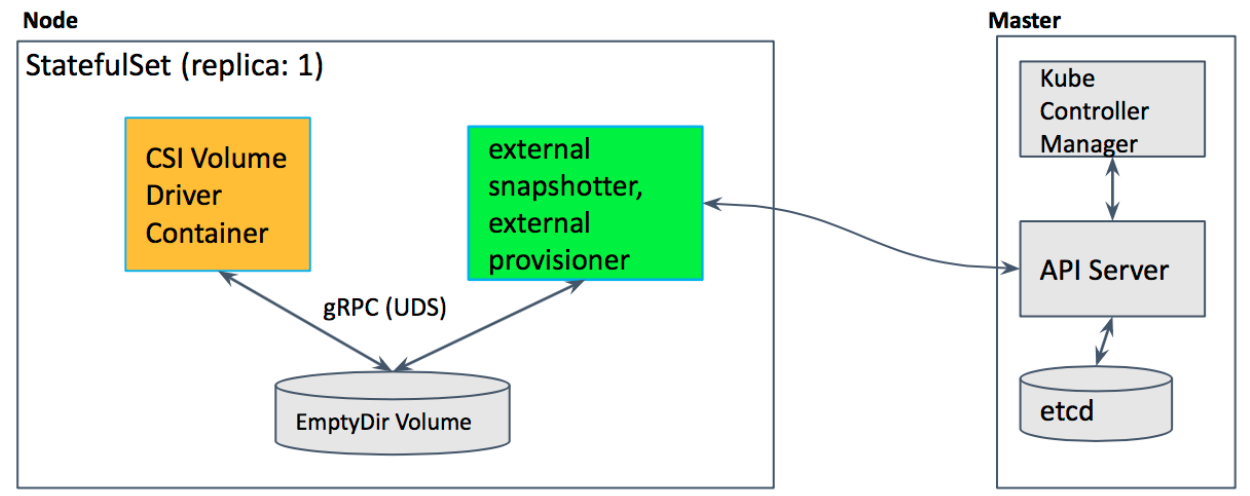
The cluster autoscaler itself runs as a pod within the kubernetes cluster. The following figure illustrates the high level view of the setup with respect to the k8s cluster:

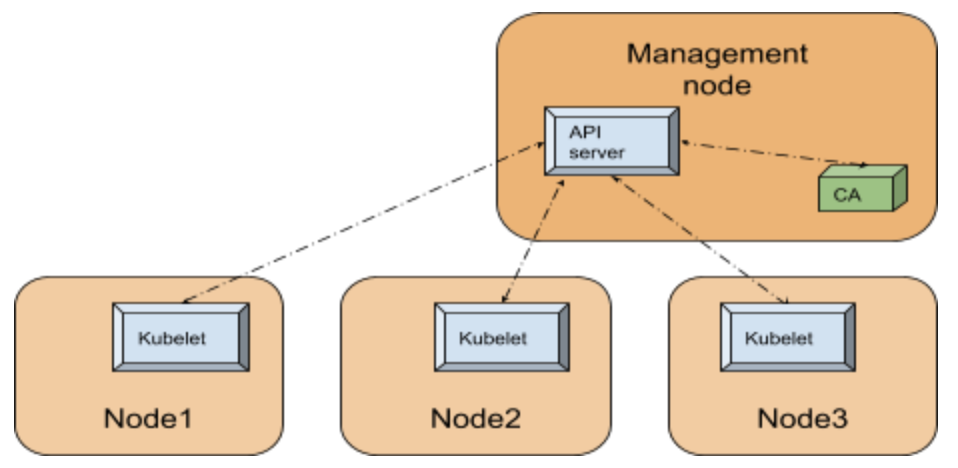
Since Cluster Autoscaler is a pod within the k8s cluster, it can use the in-cluster config and the Kubernetes go client [10] to contact the API server.

Internals

The API server is the central service which manages the state of the k8s cluster utilizing a backing store (an etcd database), runs on the management node or runs within the cloud (in case of managed service such as AKS). For any component within the Kubernetes cluster to figure out the state of the cluster, like for example the nodes registered in the cluster, contacting the API server is the way to go.

In order to simplify our discussion let’s divide the CA functionality into 3 parts as given below:

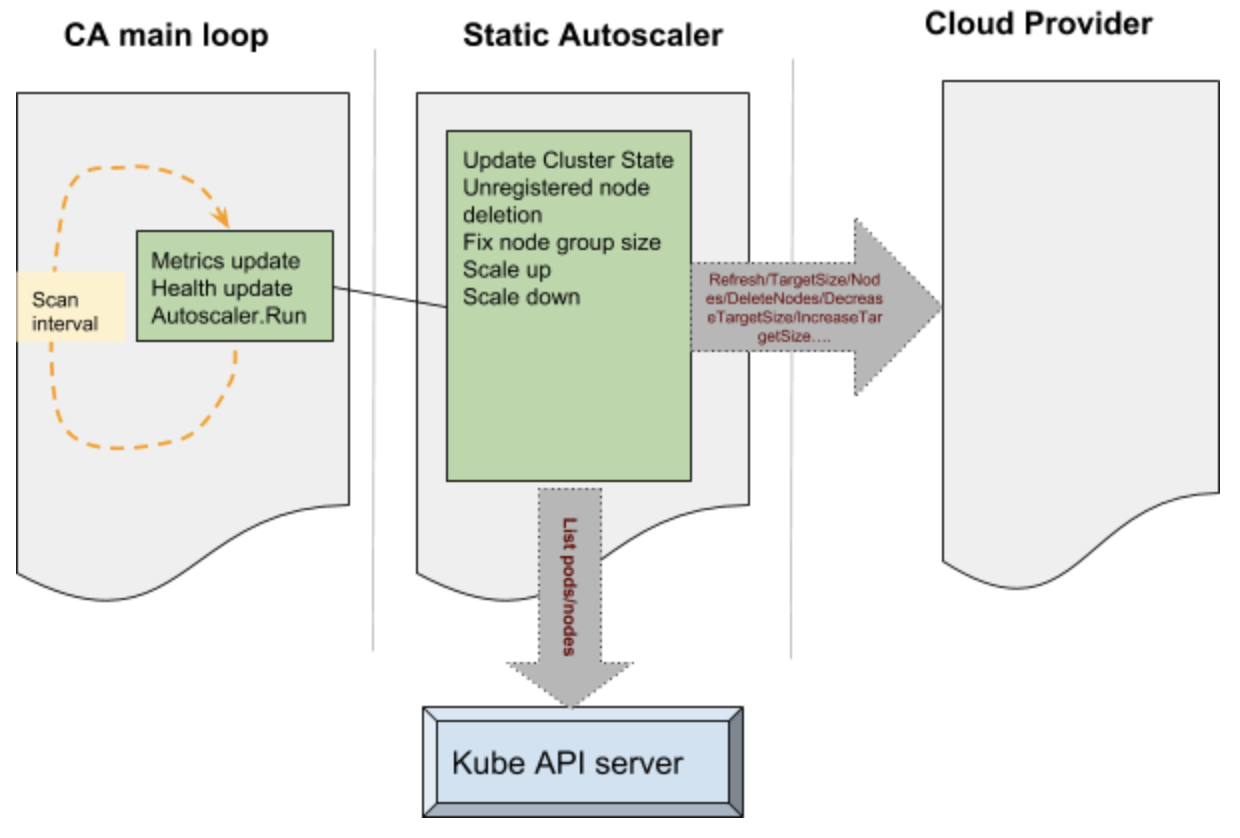
The main portion of the CA is a control loop which keeps running at every scan interval. This loop is responsible for updating the autoscaler metrics and health probes. Before this loop is entered auto scaler performs various operations such as claiming the leader state after performing a Kubernetes leader election. The main loop initializes static autoscaler component. This component initializes the underlying cloud provider based on the parameters passed onto the CA.

Various operations performed by the CA to manage the state of the cluster is passed onto the cloud provider component. Some examples like – increase target size, decrease target size etc, results in the cloud provider component talking to the cloud services internally and performing operations such as adding a node or deleting a node. These operations are performed on group of nodes in the cluster. The static autoscaler also keeps tab on the state of the system by querying the API server – operations such as list pods and list nodes are used to get hold of such information.

The decision to make a scale up is based on pods which remain unscheduled and a variety of checks and balances. The nodes which are free to be scaled down are deleted from the cluster and deleted from the cloud itself. The cluster autoscaler applies checks and balances before scaling up and scaling down – for example the nodes which have been recently added are given special consideration. During the deletion the nodes are drained to ensure that no disruption happens to the running pods.

Setting up CA on Azure:

Cluster Autoscaler is available as an add-on with acs-engine. The following link [15] has an example configuration file used to deploy autoscaler with acs-engine. The following link [8] provides details on manual step by step way to do the same.

In acs-engine case we use the the regular command line to deploy:

acs-engine deploy –subscription-id <subscription id>
–dns-prefix <dns> –location <location>
–api-model examples/kubernetes.json

The main difference are the following lines in the config file at [15] makes sure that CA is deployed as an addon:

“addons”: [
{
“name”: “cluster-autoscaler”,
“enabled”: true,
“config”: {
“minNodes”: “1”,
“maxNodes”: “5”
}
}
]

The config section in the json above can be used to provide the configuration to the cluster autoscaler pod, eg: min and max nodes as above.

Once the setup completes we can see that the cluster-autoscaler pod is deployed in the system namespace:

$kubectl get pods -n kube-system | grep autoscaler
cluster-autoscaler-7bdc74d54c-qvbjs 1/1 Running 1 6m

Here is the output from the CA configmap and events from a sample cluster:

$kubectl -n kube-system describe configmap cluster-autoscaler-status
Name: cluster-autoscaler-status
Namespace: kube-system
Labels: <none>
Annotations: cluster-autoscaler.kubernetes.io/last-updated=2018-10-02 01:21:17.850010508 +0000 UTC

Data
====
status:
—-
Cluster-autoscaler status at 2018-10-02 01:21:17.850010508 +0000 UTC:
Cluster-wide:
Health: Healthy (ready=3 unready=0 notStarted=0 longNotStarted=0 registered=3 longUnregistered=0)
LastProbeTime: 2018-10-02 01:21:17.772229859 +0000 UTC m=+3161.412682204
LastTransitionTime: 2018-10-02 00:28:49.944222739 +0000 UTC m=+13.584675084
ScaleUp: NoActivity (ready=3 registered=3)
LastProbeTime: 2018-10-02 01:21:17.772229859 +0000 UTC m=+3161.412682204
LastTransitionTime: 2018-10-02 00:28:49.944222739 +0000 UTC m=+13.584675084
ScaleDown: NoCandidates (candidates=0)
LastProbeTime: 2018-10-02 01:21:17.772229859 +0000 UTC m=+3161.412682204
LastTransitionTime: 2018-10-02 00:39:50.493307405 +0000 UTC m=+674.133759650

NodeGroups:
Name: k8s-agentpool1-92998111-vmss
Health: Healthy (ready=2 unready=0 notStarted=0 longNotStarted=0 registered=2 longUnregistered=0 cloudProviderTarget=2 (minSize=1, maxSize=5))
LastProbeTime: 2018-10-02 01:21:17.772229859 +0000 UTC m=+3161.412682204
LastTransitionTime: 2018-10-02 00:28:49.944222739 +0000 UTC m=+13.584675084
ScaleUp: NoActivity (ready=2 cloudProviderTarget=2)
LastProbeTime: 2018-10-02 01:21:17.772229859 +0000 UTC m=+3161.412682204
LastTransitionTime: 2018-10-02 00:28:49.944222739 +0000 UTC m=+13.584675084
ScaleDown: NoCandidates (candidates=0)
LastProbeTime: 2018-10-02 01:21:17.772229859 +0000 UTC m=+3161.412682204
LastTransitionTime: 2018-10-02 00:39:50.493307405 +0000 UTC m=+674.133759650

Events:
Type Reason Age From Message
—- —— —- —- ——-
Normal ScaleDownEmpty 42m cluster-autoscaler Scale-down: removing empty node k8s-agentpool1-92998111-vmss000002

As can be seen the events, the cluster autoscaler scaled down and deleted a node as there was no load on this cluster. The rest of the configmap in this case indicates that there are no further actions which the autoscaler is taking at this moment.

Current status and future:

Cluster Autoscaler currently supports four VM types: standard (VMAS), VMSS, ACS and AKS. In the future, Cluster Autoscaler will be integrated within AKS product, so that users can enable it by one-click.

User Assigned Identity

Inorder for the Kubernetes cluster components to securely talk to the cloud services, it needs to authenticate with the cloud provider. In Azure Kubernetes clusters, up until now this was done using two ways – Service Principals or Managed Identities. In case of service principal the credentials are stored within the cluster and there are password rotation and other challenges which user needs to incur to accommodate this model. Managed service identities takes out this burden from the user and manages the service instances directly [12].

There are two kinds of managed identities possible – one is system assigned and another is user assigned. In case of system assigned identity each vm in the Kubernetes cluster is assigned a managed identity during creation. This identity is used by various Kubernetes components needing access to Azure resources. Examples to these operations are getting/updating load balancer configuration, getting/updating vm information etc. With the system assigned managed identity, user has no control over the identity which is assigned to the underlying vm. The system automatically assigns it and this reduces the flexibility for the user.

With v1.12 we bring user assigned managed identity support for Kubernetes. With this support user does not have to manage any passwords but at the same time has the flexibility to manage the identity which is used by the cluster. For example if the user needs to allow access to a cluster for a specific storage account or a Azure key vault, the user assigned identity can be created in advance and key vault access provided.

Internals

To understand the internals, we will focus on a cluster created using acs-engine. This can be configured in other ways, but the basic interactions are of the same pattern.

The acs-engine sets up the cluster with the required configuration. The /etc/kubernetes/azure.json file provides a way for the cluster components (eg: kube-apiserver) to gather configuration on how to access the cloud resources. In a user managed identity cluster there is a value filled with the key as UserAssignedIdentityID. This value is filled with the client id of the user assigned identity created by acs-engine or provided by the user, however the case may be. The code which does the authentication for Kubernetes on azure can be found here [14]. This code uses Azure adal packages to get authenticated to access various resources in the cloud. In case of user assigned identity the following API call is made to get new token:

adal.NewServicePrincipalTokenFromMSIWithUserAssignedID(msiEndpoint,
env.ServiceManagementEndpoint,
config.UserAssignedIdentityID)

This calls hits either the instance metadata service or the vm extension [12] to gather the token which is then used to access various resources.

Setting up a cluster with user assigned identity

With the upstream support for user assigned identity in v1.12, it is now supported in the acs-engine to create a cluster with the user assigned identity. The json config files present here [13] can be used to create a cluster with user assigned identity. The same step used to create a vmss cluster can be used to create a cluster which has user assigned identity assigned.

acs-engine deploy –subscription-id <subscription id>
–dns-prefix <dns> –location <location>
–api-model examples/kubernetes-msi-userassigned/kube-vmss.json

The main config values here are the following:

“useManagedIdentity”: true
“userAssignedID”: “acsenginetestid”

The first one useManagedIdentity indicates to acs-engine that we are going to use the managed identity extension. This sets up the necessary packages and extensions required for the managed identities to work. The next one userAssignedID provides the information on the user identity which is to be used with the cluster.

Current status and future

Currently we support the user assigned identity creation with the cluster using deploy of the acs-engine. In future this will become part of AKS.

Get involved

For azure specific discussions – please checkout the Azure SIG page at [6] and come and join the #sig-azure slack channel for more.

For CA, please checkout the Autoscaler project here [7] and join the #sig-autoscaling Slack for more discussions.

For the acs-engine (the unmanaged variety) on Azure docs can be found here: [9]. More details about the managed service from Azure Kubernetes Service (AKS) here [5].

References

1) https://docs.microsoft.com/en-us/azure/virtual-machine-scale-sets/overview

2) https://kubernetes.io/docs/concepts/architecture/cloud-controller/

3) https://github.com/kubernetes/kubernetes/blob/master/pkg/cloudprovider/providers/azure/azure_vmss.go

4) https://github.com/Azure/acs-engine/blob/master/docs/kubernetes/deploy.md

5) https://docs.microsoft.com/en-us/azure/aks/

6) https://github.com/kubernetes/community/tree/master/sig-azure

7) https://github.com/kubernetes/autoscaler

8) https://github.com/kubernetes/autoscaler/blob/master/cluster-autoscaler/cloudprovider/azure/README.md

9) https://github.com/Azure/acs-engine

10) https://github.com/kubernetes/client-go

11) https://kubernetes.io/docs/concepts/architecture/

12) https://docs.microsoft.com/en-us/azure/active-directory/managed-identities-azure-resources/overview

13) https://github.com/Azure/acs-engine/tree/master/examples/kubernetes-msi-userassigned

14) https://github.com/kubernetes/kubernetes/blob/master/pkg/cloudprovider/providers/azure/auth/azure_auth.go

15) https://github.com/Azure/acs-engine/tree/master/examples/addons/cluster-autoscaler

Source

A Conversation with Jetstack’s Head of Growth // Jetstack Blog

31/Aug 2018

By Hannah Morris

Simon, our Head of Growth, details his experience as part of the growing commercial team at Jetstack.

What are your main duties as Head of Growth at Jetstack?

‘Head of Growth’ is a relatively new title that has been more recently adopted by fast growing tech companies. It can mean different things to different people but the role is usually focused on scaling a business, product or customers. In my case, at Jetstack, I lead the business development side of the organisation which includes our Sales & Go-to-Market, Marketing and PR functions. We’ve already achieved such a fantastic engineering reputation since being founded in 2015, and my main goal is to continue revenue growth by maturing the commercial arm of the business.

team drinks

Team drinks at the Founder’s Arms

What’s your career history and what made you want to work for Jetstack?

I’ve always been a technologist. I loved building overclocked watercooled PCs as a teen (sinking hours into Call of Duty and FIFA), which led me to start my career in a DevOps team at IBM. As I progressed, I moved into more customer-facing technical sales roles at companies like Cloud Sherpas and Accenture, as I enjoyed solving complex customer business challenges with technology.

I’ve been very fortunate to meet with a number of CIO/CTOs in recent years, nearly all of whom were facing challenges in turning overused buzz-terms like ‘digital transformation’ into tangible projects. They were trying to identify work streams that struck a balance between delivering value to their organisation and helping them to compete against disruptive startups.

I was introduced to Jetstack via an ex-colleague and was immediately impressed by their reputation among the cloud vendors, customers and developers in the open source community. Although I’ve previously worked for some very big companies, I was witnessing a change in how customers (both startups and enterprises alike) are becoming less likely to work with uber-broad systems integrators. In fact, I found that they had a preference to work with smaller technology specialists, who focus on really deep subject matter expertise. For Jetstack, this is Kubernetes.

When I joined Jetstack, sales operations was almost greenfield – we were using Gitlab as our CRM! It’s been one of my most enjoyable roles yet to work with the founders and talented wider team to build a Go-to-Market strategy, sales process and value proposition, whilst looking after some of our strategic new business.

working

Video Editing at Kube Con 2018

What is day-to-day life like in your role?

My role is incredibly varied and that’s what I love the most. Yesterday, for example, I spent the morning on a company-wide call reporting our booked business, and forecasting what we expect to close in Q4. I also discussed the partner news from Google NEXT 2018 in San Francisco, which I’d attended a few weeks prior. That afternoon, I met with a customer to discuss the challenges around upskilling their team on Kubernetes, Day 2 operations and a future multi-cloud strategy. I finished up the day working with some colleagues on a revamped careers section on the Jetstack website!

I also occasionally have time to to mess about with some filming/editing

In my opinion, Jetstack hits the mark on flexibility, autonomy and accountability. We still have a startup culture with a very friendly atmosphere, and there is a large amount of expertise on hand for anyone new to learn and grow personally, and professionally.

What is the most exciting part of your work at Jetstack?

Playing table tennis 5 times a day….?!

In all seriousness, the most exciting part is definitely the growth potential of the company in an industry that is exploding. In only six months at Jetstack, I’ve worked with both ‘born-in-the-cloud’ and enterprise companies alike. It’s been a very interesting process to work on often complex deals and see the fantastic achievements of both the engineers and the commercial team.

team at kube con

The Jetstack Team at Kube Con 2018

I tweet about work related topics @simonjohnparker on twitter, but make sure to follow Jestack’s accounts on instagram and twitter also. I’m always on the lookout for talented sales people as we grow – if you are interested, reach out to me at simon@jetstack.io.

Source

Introducing Heptio Contour 0.6 – Heptio

David Cheney, Steve Sloka, Alex Brand, and Ross Kukulinski

After several months of hard work behind the scenes, Heptio is proud to take the wraps off a brand new version of Heptio Contour, our Envoy based Ingress controller for Kubernetes.

An iceberg is 90% below the waterline

At its heart, Heptio Contour is a translator between Kubernetes’ API server and Envoy. This is its raison d’être. The big news for Heptio Contour 0.6 is that this translation layer has been entirely rewritten.

Previously, Heptio Contour would translate Kubernetes objects directly into their Envoy counterparts. In Heptio Contour 0.6, the Kubernetes objects that describe a web application deployment— ​hostnames, TLS certificates, routes, and backend services — ​are used to build a Directed Acyclic Graph (DAG).

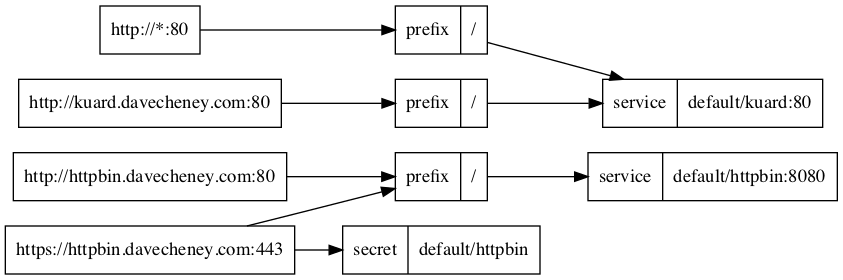
(You can generate graphs like these from your Heptio Contour installation. See the troubleshooting documentation.)

The DAG abstracts away the specifics of the Kubernetes Ingress object and allows Heptio Contour to model the semantics of a web application deployment without being tied closely to either Kubernetes’ or Envoy’s data models.

For example, routes are treated as first class objects in the DAG, rather than fragments of YAML in the Ingress spec. Another example: because the canonical representation of your web service is defined by the contents of the DAG, adding support for multiple services connected to a single route becomes trivial. Finally, using the DAG allows Heptio Contour to support alternative ways of describing a web application deployment, like our headline 0.6 release feature, IngressRoute.

IngressRoute what?

Since it was added in Kubernetes 1.1, Ingress hasn’t seen much attention — ​it’s still in beta — ​but boy is it popular! There are close to a dozen Ingress controllers in use today trying to do their best with the unfinished Ingress object. Mostly this involves a cornucopia of annotations on the Ingress object to clarify, restrict, or augment the structure imposed by the Ingress object. In this respect, Heptio Contour is much the same as any other Ingress controller.

At the same time a number of web application deployment patterns like blue/green deployments, explicit load balancing strategies, and presenting more than one Kubernetes Service behind a single route, are difficult to achieve with Ingress as it stands today.

In collaboration with Actapio, a subsidiary of Yahoo Japan Corporation, we’ve added a new kind of layer seven ingress object to Heptio Contour. We call it IngressRoute.

We designed the IngressRoute CRD spec to do two things. The first is to provide a sensible home for configuration parameters that were previously crammed into annotations. The second is a mechanism to make it safer to share an ingress controller across multiple namespaces and teams in the same Kubernetes cluster. We do this using a process we call delegation.

Much like the way a subdomain is delegated from one domain name server to another, an IngressRoute may delegate control of some, or all, of the HTTP routing prefixes it controls to another IngressRoute.

# root.ingressroute.yaml
apiVersion: contour.heptio.com/v1beta1
kind: IngressRoute
metadata:
name: bar-com-root
namespace: default
spec:
virtualhost:
fqdn: root.bar.com
routes:
– match: /
services:
– name: s1
port: 80
# delegate the path, `/service2` to the IngressRoute object in this namespace with the name `service2`
– match: /service2
delegate:
name: bar-com-service

# service2.ingressroute.yaml
apiVersion: contour.heptio.com/v1beta1
kind: IngressRoute
metadata:
name: bar-com-service
namespace: default
spec:
routes:
– match: /service2
services:
– name: s2
port: 80
– match: /service2/blog
services:
– name: blog
port: 80

In this example the routes below http://root.bar.com/service2 are managed by the author of the bar-com-service IngressRoute object. The IngressRoute object bar-com-root is functioning as the “root” and the bar-com-service is the “delegation” IngressRoute object. This delegation also works across namespaces, allowing the ownership of the root of an IngressRoute, its hostname and TLS secret, to be handled in a namespace that is separate from the IngressRoute routes and Kubernetes Services that provide the web application itself.

That all means that Heptio Contour 0.6 has an ability to restrict the namespaces it uses to respond to IngressRoute roots. We’re excited about the possibilities this offers for deploying Heptio Contour in multi-team Kubernetes clusters.

You can read more about IngressRoute in the Heptio Contour docs/ directory

What next?

Over the next few weeks we’ll be writing about how you can use the new features of IngressRoute to implement patterns like blue/green deployment, load balancing strategies, and cross namespace delegation.

If you’re interested in hearing more about IngressRoute developments, you can find us on the Kubernetes #contour Slack channel or follow us on Twitter.

Last updated 2018–09–24 17:20:50 AEST

Source

Logging Best Practices for Kubernetes using Elasticsearch, Fluent Bit and Kibana

Logging Best Practices for Kubernetes using Elasticsearch, Fluent Bit and Kibana

Logging is one of the most powerful tools we have as developers. It’s no accident that when things go wrong in production, one of a developer’s first questions is often – “can you send me the logs?”. Raw logs contain useful information but they can be hard to parse. So, when operating systems at scale, using structured logging can greatly increase the usefulness of your logs. Using a common structure it makes the logs easier to search, and also makes automated processing of logs much easier.

At Giant Swarm we use structured logging throughout our control plane to manage Kubernetes clusters for our customers. We use the EFK stack to do this, which consists of Elasticsearch, Fluent Bit and Kibana. The EFK stack is based on the widely used ELK stack which uses Logstash instead of Fluent Bit or Fluentd.

This post explains some of the best practices we follow for structuring our logs, and how we use the EFK stack to manage them. Coming soon we’ll also be providing managed logging infrastructure to our customers as part of the Managed Cloud Native Stack.

How we write logs

Our control plane consists of multiple microservices and Kubernetes operators. As a reminder, an operator in Kubernetes is a custom controller, paired with a CRD (Custom Resource Definition), that extends the Kubernetes API.

For our microservices we develop them in our microkit framework which is based on Go-Kit. Our operators are developed using our operatorkit framework. These frameworks both use our micrologger library. Since all our logs flow through a single library we can enrich the logs with extra data. This also makes the structure of our logs very consistent.

For example, we can add data like a tenant cluster’s ID to the Golang context we pass inside our operator code. We use this to create a self-link to the CR (custom resource) that the operator is processing. This is the same approach as the self-links exposed by the Kubernetes API and makes the logs easier to read.

What we log

We use a JSON format for our logs, which makes it easier for Fluent Bit to process them. It also means the data is more structured when it’s stored in Elasticsearch. We use a pretty standard format with the log level (e.g debug or error) and the log message. For errors, we add a stack entry with the full call stack.

We use the frameworks described earlier to enrich the log messages with extra information, such as the timestamp, self-link or the event the operator is processing (e.g create or update).

Elasticsearch

Elasticsearch is at the heart of the EFK stack. It’s a NoSQL database based on the Lucene search engine. Its origin as a search engine also makes it good at querying log data. It can ingest large volumes of data, store it efficiently and execute queries quickly. In the EFK stack, Elasticsearch is used for log storage, and receives log data from Fluent, which is the log shipper. The log data is stored in an Elasticsearch index and is queried by Kibana.

As you’d expect we deploy Elasticsearch using Kubernetes. Each control plane we manage for our customers has its own deployment of Elasticsearch. This isolates it from all other control planes. On AWS and Azure, we use cloud storage with Persistent Volumes for storing the index data. In on-premise control planes, the data is stored on physical storage.

Fluent Bit

Logging is an area of Cloud Native applications where there are many options. We currently use Fluent Bit but we have previously evaluated many other options, including Logstash (the L in the very popular ELK stack), and Filebeat which is a lightweight log shipper from Elastic.co.

We initially ruled out Logstash and Filebeat, as the integration with Kubernetes metadata was not very advanced. So we started our implementation using Fluentd. Fluentd is a log shipper that has many plugins. It provides a unified logging layer that forwards data to Elasticsearch. It’s also a CNCF project and is known for its Kubernetes and Docker integrations which are both important to us.

Fluentd uses Ruby and Ruby Gems for configuration of its over 500 plugins. Since Ruby is an interpreted language it also makes heavy usage of C extensions for parsing log files and forwarding data to provide the necessary speed. However, due to the volume of logs we ingest we hit performance problems, and so we evaluated the related Fluent Bit project.

Fluent Bit is implemented solely in C and has a restricted set of functionality compared to Fluentd. However, in our case it provides all the functionality we need and we are much happier with the performance. We deploy Fluent Bit as a daemon set to all nodes in our control plane clusters. The Fluent Bit pods on each node mount the Docker logs for the host which gives us access to logs for all containers across the cluster.

A shout out here to Eduardo Silva who is one of the Fluent Bit maintainers, and helped us a lot with answering questions while we worked on the integration.

Log Retention – Curator

Logging is great but it can quickly use up a lot of disk space. So having a good log retention policy is essential. Fluent Bit helps here because it creates daily indices in Elasticsearch. We have a daily cron job in Kubernetes that deletes indices older than n days. The cron job calls the curator component which deletes the old indices.

There is a Curator component from Elastic.co but we use our own simpler version that meets our requirements. It’s available on GitHub giantswarm/curator. Deleting the indices is an intensive process for disk I/O, so another trick we use is to run the cron job at an unusual time like 02:35 rather than at 02:00 – this avoids conflicting with other scheduled tasks.

Kibana

Kibana provides the UI for the stack, with the front end and query engine for querying the logs in Elasticsearch. Kibana supports the Lucene query syntax as well as its own extended Query DSL that uses JSON. Another nice feature is the built-in support for visualizations for use in dashboards.

One challenge we faced was how to configure Kibana. We run an instance of Kibana in each control plane and we want them all to be kept in sync with the same base configuration. This includes setting the index pattern in Kibana for which Elasticsearch indices it should search.

We’re using Kibana 6 and until recently it didn’t have a documented configuration API. So instead we wrote a simple sidecar giantswarm/kibana-sidecar, that sets the configuration. This is working pretty well, but needs to be adapted for each version of Kibana. Elastic.co have recently published documentation for the Saved Objects API for configuration, which may move to this in future.

Conclusion

In this post we’ve shown you how we use structured logging and the EFK stack to manage Kubernetes clusters for our customers. There are many options for logging when building Cloud Native applications. We’ve evaluated several options and found a set of tools that work well for us.

However, one of the benefits of the EFK and ELK stacks is they are very flexible. So if you want to use a different tool for log storage like Kafka – you just configure Fluent to ship to Kafka. This also works for 3rd party log storage providers, like DataDog and Splunk. You can also use a different log shipper like Filebeat or Logstash, if they better suit your needs.

Coming soon we’ll also be offering a Managed Logging infrastructure to our customers as part of the Managed Cloud Native Stack. This will let our customers take advantage of the rich functionality provided by the EFK stack. However, it will be fully managed by us, using our operational knowledge of running the EFK stack in production. Request your free trial of the Giant Swarm Infrastructure here.

Source

Some Admission Webhook Basics – Container Solutions

Jul 10, 2018

by Jason Smith

Admission Webhooks are a new feature in Kubernetes since 1.9 that allows you to intercept manifests prior to them being deployed. This gives you a lot of control to do things like inject sidecars, attach volumes, or validate image repositories before the object gets deployed. I took some time over the last two days to explore this feature and how to implement it. Let me share what I have learned…

As of this writing this you need a cluster running Kubernetes 1.11 or better. You may say, “but it has been supported since… 1.9” You would be correct… BUT prior to 1.11, if you sent a malformed request you could potentially crash your kube-api server. This is probably not the most ideal situation to be in, and could really hinder your development efforts.

So, you need a running cluster. Do you intend to run minikube? Well as of this writing you will need to compile that from source because the latest release is not compatible with 1.11. If you want to get minikube running with Kubernetes 1.11, you can clone the minikube repo and run make, and it should produce ./out/minikube

This entire tutorial is based off this demo repository. So you should clone it and work from inside it.

Finally, I highly recommend you download json-patch cli utility. This is the same package Kubernetes uses to apply its patches, and the cli will help you write your patches before writing your webhook.

Assuming you are using minikube you can run:

$ minikube start –kubernetes-version v1.11.0

Let’s start by just running the pause application. From the demo repository, run:

$ kubectl apply -f test.yaml

So right now Kubernetes only currently supports jsonpatch for mutating objects. We can play around with our patches prior to actually writing our webhook, to see if what we want to do is going to work and that our patch is correct… so we don’t crash our kube-api server.

Currently, we have the pause container running in mwc-test namespace. In the demo repository, you will find a folder titled “jsonpatchtests”. Inside it, we have two patches, one that adds a label to the labels object, and another that creates a labels array under the labels object.

When Kubernetes returns a pod object, if the pod has no labels, the labels object is not passed back in the json of the pod definition. With my limited understanding of jsonpatch if I add an array and one exists, it will overwrite the existing labels array. If I add one to the labels path and it does not have any labels it will complain that the path “/metadata/labels” does not exist.

Feel free to play around, by removing the labels from test.yaml and applying the patches or make your own. Below is an explanation of how to do this.

I am new to jsonpatch, and I am still learning, I welcome commenters suggesting better methods.

Test A Patch

So we can test a patch straight from the command line by just piping an object definition straight into json-patch.

I will be using jq through these commands because it offers pretty output.

So if we run a patch like this:

$ kubectl get pod -n mwc-test pause -o json | json-patch -p jsonpatchtests/patch1.json | jq .

We can see the patch was applied to the json


1

2

3

4

5

6

7

8

9

10

11

12

13

14

15

16

17

18

19


{

“apiVersion”: “v1”,

“kind”: “Pod”,

“metadata”: {

“labels”: {

“test”: “label”,

“thisisanewlabel”: “hello” <–This was added… Yay!

},

}

}


So now we have a working patch, we can copy that directly into our webhook.

The Webhook is a pretty simple setup:

  1. Http server to actually admit or mutate the object
  2. A Deployment for the http server
  3. A Service for the http server
  4. And a MutatingWebhookConfiguration 

2, 3 and 4 can be found in the demo repository in manifest.yaml. 2 and 3 are pretty self-explanatory, so we will focus on 1 and 4.

Anatomy of the Webhook Server

So I based my code off the e2e tests Kubernetes suggests to use as a launching point. I found some cruft in that Go code and weird naming conventions were causing me more confusion than helping. So I wrote a simpler example in Go that had long names with better comments.

We can find this in main.go.

I will not go through line by line but I will explain the basic concepts here.

  1. Kubernetes submits an AdmissionReview to your webhook, containing
    1. an AdmissionRequest, which has
      1. a UID
      2. a Raw Extension carrying full json payload for an object, such as a Pod
      3. And other stuff that you may or may not use
  2. Based on this information you apply your logic and you return a new AdmissionReview
  3. The AdmissionReview contains an
    1. AdmissionResponse which has
      1. the original UID from the AdmissionRequest
      2. A Patch (if applicable)
      3. The Allowed field which is either true or false

That is pretty much it. The above objects have a lot more data, but I am just focusing on the ones I am using in the main.go example.

The MutatingWebhookConfiguration

The configuration is pretty straightforward


1

2

3

4

5

6

7

8

9

10

11

12

13

14

15

16

17

18

19

20

21

22

23

24

25

26

27

28

29

30

31

32

33

34

35

36

37

38

39

40

41

42

43


apiVersion: admissionregistration.k8s.io/v1beta1

kind: MutatingWebhookConfiguration

metadata:

name: mwc-example

webhooks:

– name: mwc-example.jasonrichardsmith.com # this needs to be unique

clientConfig:

Service: # The below targets the service we deployed

name: mwc-example

namespace: mwc-example

path: “/mutating-pods”

caBundle: “$” # This will be inserted from ca files that we generate

rules:

– operations: [“CREATE”,”UPDATE”] # This is the actions to trigger on

apiGroups: [“”]

apiVersions: [“v1”]

resources: [“pods”] # These are the objects to trigger for

failurePolicy: Fail # This is what happens if something goes wrong

namespaceSelector:

matchLabels:

mwc-example: enabled # The label a namespace must have to invoke the webhook


So let’s try it out.

I am going to assume we are working on minikube. To deploy to a real cluster, you will want to change the REPO to one you own in the Makefile and the image referenced in the deployment in manifest.yaml.

So to run this we will do the following.

First, tear down the pause pod you deployed.

$ kubectl delete -f test.yaml


Build the webhook image

This only requires make, minikube and Docker. This will build the image on the minikube server so we do not have to push it to a repo.

If you are using your own repo you can run the below command, after editing the Makefile REPO variable.

Secrets and Certs

This whole process will require Secrets and Certs. I stole and slightly altered a bash script from the Istio sidecar injector to demonstrate this. I am not going to get into what this is doing, because it is out of scope.

First, create the namespace:

$ kubectl apply -f ns.yaml


Then generate certs and secrets

We will take the cert we created and stick it into the manifest for the webhook.

This will produce a new manifest manifest-ca.yaml. We can deploy that.

$ kubectl apply -f manifest-ca.yaml


If everything went well you should see this:

service/mwc-example created

deployment.apps/mwc-example created

mutatingwebhookconfiguration.admissionregistration.k8s.io/mwc-example created


Now we can deploy the test.yaml. Which if you inspect you will see the namespace has a label which was required for our MutatingWebhookConfiguration to apply the webhook to a namespace.

$ kubectl apply -f test.yaml


You should get this response

namespace/mwc-test created

pod/pause created


The Big question is … Did it Work?

$ kubectl get pods -n mwc-test -o json | jq .items[0].metadata.labels


Did you get this?

{

“test”: “label”,

“thisisanewlabel”: “hello”

}


This blog post stole from, was inspired by, the following content:

IBM’s article on Mutating Admission Webhooks

The Istio repo

Kubernetes e2e test

The Kubernetes Docs

Thanks for reading!

Read more about where we think Kubernetes is in its lifecycle in our whitepaper.

Download Whitepaper

Source

Setup a basic Kubernetes cluster with ease using RKE


Expert Training in Kubernetes and Rancher

Join our free online training sessions to learn how to manage Kubernetes workloads with Rancher.

Sign up here

In this post, you will go from 3 Ubuntu 16.04 nodes to a basic Kubernetes cluster in a few simple steps. To accomplish this, you will be using Rancher Kubernetes Engine (RKE). To be able to use RKE, you will need 3 Linux nodes with Docker installed (see Requirements below).

This won’t be a production ready cluster, but enough to get you familiar with RKE, some Kubernetes and be able to play around with the cluster. Keep an eye out for the post for building a production ready cluster.

Requirements

  • RKE

You will be using RKE from your workstation. Download the latest version for your platform at:
https://github.com/rancher/rke/releases/latest

  • kubectl

After creating the cluster, we will use the default Kubernetes command-line tool called kubectl to interact with the cluster.
Get the latest version for your platform at:
https://kubernetes.io/docs/tasks/tools/install-kubectl/

  • 3 Ubuntu 16.04 nodes with 2(v)CPUs, 4GB of memory and with swap disabled

Most commonly used Linux distribution is Ubuntu 16.04, this is what will be used in this post. Make sure swap is disabled by running swapoff -a and removing any swap entry in /etc/fstab. You must be able to access the node using SSH. As this is a multi-node cluster, the required ports need to be opened before proceeding.

  • Docker installed on each Linux node

Kubernetes only validates Docker up to 17.03.2 (See https://github.com/kubernetes/kubernetes/blob/master/CHANGELOG-1.11.md#external-dependencies).
You can use https://docs.docker.com/install/linux/docker-ce/ubuntu/ to install Docker (make sure you install 17.03.2) or use this one-liner to install the correct version:
curl https://releases.rancher.com/install-docker/17.03.sh | sh

Make sure the requirements listed above are fulfilled before you proceed.

How RKE works

RKE can be run from any platform (the binary is available for MacOS/Linux/Windows), in this example it will run on your workstation/laptop/computer. The examples in this post are based on MacOS/Linux.

RKE will connect to the nodes using a configured SSH private key (the nodes should have the matching SSH public key installed for the SSH user) and setup a tunnel to access the Docker socket (/var/run/docker.sock by default, but configurable). This means that the configured SSH user must have access to the Docker socket on the machine, we will go over this in Creating the Linux user account.

Creating the Linux user account

Note: Make sure Docker is installed following the instructions in the Requirements section above.

The following steps need to be executed on every node. If you need to use sudo, prefix each command with sudo. If you already have users that can access the machine using a SSH key and can access the Docker socket, you can skip this step.

# Login to the node
$ ssh [email protected]
# Create a Linux user called rke, create home directory, and add to docker group
$ useradd -m -G docker rke
# Switch user to rke and create SSH directories
$ su – rke
$ mkdir $HOME/.ssh
$ chmod 700 $HOME/.ssh
$ touch $HOME/.ssh/authorized_keys
# Test Docker socket access
$ docker version
Client:
Version: 17.03.2-ce
API version: 1.27
Go version: go1.7.5
Git commit: f5ec1e2
Built: Tue Jun 27 03:35:14 2017
OS/Arch: linux/amd64

Server:
Version: 17.03.2-ce
API version: 1.27 (minimum version 1.12)
Go version: go1.7.5
Git commit: f5ec1e2
Built: Tue Jun 27 03:35:14 2017
OS/Arch: linux/amd64
Experimental: false

Configuring SSH keys

In this post we will create new keys but feel free to use your existing keys. Just make sure you specify them correctly when we configure the keys in RKE.

Note: If you want to use SSH keys with a passphrase, you will need to have ssh-agent running with the key added and specify –ssh-agent-auth when running RKE.

Creating SSH key pair
Creating an SSH key pair can be done by using ssh-keygen , you can execute this on your workstation/laptop/computer. It is highly recommended to put a passphrase on your SSH private key. If you lose your SSH private key (and not have a passphrase on it), anyone can use it to access your nodes.

$ ssh-keygen
Generating public/private rsa key pair.
Enter file in which to save the key ($HOME/.ssh/id_rsa):
Enter passphrase (empty for no passphrase):
Enter same passphrase again:
Your identification has been saved in $HOME/.ssh/id_rsa.
Your public key has been saved in $HOME/.ssh/id_rsa.pub.
The key fingerprint is:
xxx

After creating the SSH key pair, you should have the following files:

  • $HOME/.ssh/id_rsa (SSH private key, keep this secure)
  • $HOME/.ssh/id_rsa.pub (SSH public key)

Copy the SSH public key to the nodes
To be able to access the nodes using the created SSH key pair, you will need to install the SSH public key onto the nodes.

Execute this for every node (where hostname is the IP/hostname of the node):

# Install the SSH public key on the node
$ cat $HOME/.ssh/id_rsa.pub | ssh hostname “sudo tee -a /home/rke/.ssh/authorized_keys”

Note: This post is demonstrating how you create a separate user for RKE. Because of this, we can’t use ssh-copy-id as it only works for installing keys to the same user as is used for the SSH connection.

Setup ssh-agent

Note: If you chose not to put a passphrase on your SSH private key, you can skip this step.

This needs to be executed on your workstation/laptop/computer:

# Run ssh-agent and configure the correct environment variables
$ eval $(ssh-agent)
Agent pid 5151
# Add the private key to the ssh-agent
$ ssh-add $HOME/.ssh/id_rsa
Identity added: $HOME/.ssh/id_rsa ($HOME/.ssh/id_rsa)

Test SSH connectivity
Last step is to test if we can access the node using the SSH private key. This needs to be executed on your workstation/laptop/computer, replacing hostname with each of the nodes IP/hostname):

$ ssh -i $HOME/.ssh/id_rsa [email protected] docker version
Client:
Version: 17.03.2-ce
API version: 1.27
Go version: go1.7.5
Git commit: f5ec1e2
Built: Tue Jun 27 03:35:14 2017
OS/Arch: linux/amd64

Server:
Version: 17.03.2-ce
API version: 1.27 (minimum version 1.12)
Go version: go1.7.5
Git commit: f5ec1e2
Built: Tue Jun 27 03:35:14 2017
OS/Arch: linux/amd64
Experimental: false

Configuring and running RKE

Get RKE for your platform at:
https://github.com/rancher/rke/releases/latest.

RKE will run on your workstation/laptop/computer.

For this post I’ve renamed the RKE binary to rke, to make the commands generic for each platform. You can do the same by running:

Test if RKE can be successfully executed by using the following command:

# Download RKE for MacOS (Darwin)
$ wget https://github.com/rancher/rke/releases/download/v0.1.9/rke_darwin-amd64
# Rename binary to rke
mv rke_darwin-amd64 rke
# Make RKE binary executable
$ chmod +x rke
# Show RKE version
$ ./rke –version
rke version v0.1.9

Next step is to create a cluster configuration file (by default it will be cluster.yml). This contains all information to build the Kubernetes cluster, like node connection info, what roles to apply to what node etcetera. All configuration options can be found in the documentation. You can create the cluster configuration file by running ./rke config and answering the questions. For this post, you will create a 3 node cluster with every role on each node (answer y for every role), and we will add the Kubernetes Dashboard as addon (Using https://raw.githubusercontent.com/kubernetes/dashboard/master/src/deploy/recommended/kubernetes-dashboard.yaml). To access the Kubernetes Dashboard, you need a Service Account token which will be created by adding https://gist.githubusercontent.com/superseb/499f2caa2637c404af41cfb7e5f4a938/raw/930841ac00653fdff8beca61dab9a20bb8983782/k8s-dashboard-user.yml to the addons.

Regarding answering the question to create the cluster configuration file:

  • The values in brackets, for instance [22] for SSH Port, are defaults and can just be used by pressing the Enter key.
  • The default SSH Private Key would do, if you have another key, please change it.

    $ ./rke config
    [+] Cluster Level SSH Private Key Path [~/.ssh/id_rsa]: ~/.ssh/id_rsa
    [+] Number of Hosts [1]: 3
    [+] SSH Address of host (1) [none]: ip_or_dns_host1
    [+] SSH Port of host (1) [22]:
    [+] SSH Private Key Path of host (ip_or_dns_host1) [none]:
    [-] You have entered empty SSH key path, trying fetch from SSH key parameter
    [+] SSH Private Key of host (ip_or_dns_host1) [none]:
    [-] You have entered empty SSH key, defaulting to cluster level SSH key: ~/.ssh/id_rsa
    [+] SSH User of host (ip_or_dns_host1) [ubuntu]: rke
    [+] Is host (ip_or_dns_host1) a Control Plane host (y/n)? [y]: y
    [+] Is host (ip_or_dns_host1) a Worker host (y/n)? [n]: y
    [+] Is host (ip_or_dns_host1) an etcd host (y/n)? [n]: y
    [+] Override Hostname of host (ip_or_dns_host1) [none]:
    [+] Internal IP of host (ip_or_dns_host1) [none]:
    [+] Docker socket path on host (ip_or_dns_host1) [/var/run/docker.sock]:
    [+] SSH Address of host (2) [none]: ip_or_dns_host2
    [+] SSH Port of host (2) [22]:
    [+] SSH Private Key Path of host (ip_or_dns_host2) [none]:
    [-] You have entered empty SSH key path, trying fetch from SSH key parameter
    [+] SSH Private Key of host (ip_or_dns_host2) [none]:
    [-] You have entered empty SSH key, defaulting to cluster level SSH key: ~/.ssh/id_rsa
    [+] SSH User of host (ip_or_dns_host2) [ubuntu]: rke
    [+] Is host (ip_or_dns_host2) a Control Plane host (y/n)? [y]: y
    [+] Is host (ip_or_dns_host2) a Worker host (y/n)? [n]: y
    [+] Is host (ip_or_dns_host2) an etcd host (y/n)? [n]: y
    [+] Override Hostname of host (ip_or_dns_host2) [none]:
    [+] Internal IP of host (ip_or_dns_host2) [none]:
    [+] Docker socket path on host (ip_or_dns_host2) [/var/run/docker.sock]:
    [+] SSH Address of host (3) [none]: ip_or_dns_host3
    [+] SSH Port of host (3) [22]:
    [+] SSH Private Key Path of host (ip_or_dns_host3) [none]:
    [-] You have entered empty SSH key path, trying fetch from SSH key parameter
    [+] SSH Private Key of host (ip_or_dns_host3) [none]:
    [-] You have entered empty SSH key, defaulting to cluster level SSH key: ~/.ssh/id_rsa
    [+] SSH User of host (ip_or_dns_host3) [ubuntu]: rke
    [+] Is host (ip_or_dns_host3) a Control Plane host (y/n)? [y]: y
    [+] Is host (ip_or_dns_host3) a Worker host (y/n)? [n]: y
    [+] Is host (ip_or_dns_host3) an etcd host (y/n)? [n]: y
    [+] Override Hostname of host (ip_or_dns_host3) [none]:
    [+] Internal IP of host (ip_or_dns_host3) [none]:
    [+] Docker socket path on host (ip_or_dns_host3) [/var/run/docker.sock]:
    [+] Network Plugin Type (flannel, calico, weave, canal) [canal]:
    [+] Authentication Strategy [x509]:
    [+] Authorization Mode (rbac, none) [rbac]:
    [+] Kubernetes Docker image [rancher/hyperkube:v1.11.1-rancher1]:
    [+] Cluster domain [cluster.local]:
    [+] Service Cluster IP Range [10.43.0.0/16]:
    [+] Enable PodSecurityPolicy [n]:
    [+] Cluster Network CIDR [10.42.0.0/16]:
    [+] Cluster DNS Service IP [10.43.0.10]:
    [+] Add addon manifest URLs or YAML files [no]: yes
    [+] Enter the Path or URL for the manifest [none]: https://raw.githubusercontent.com/kubernetes/dashboard/master/src/deploy/recommended/kubernetes-dashboard.yaml
    [+] Add another addon [no]: yes
    [+] Enter the Path or URL for the manifest [none]: https://gist.githubusercontent.com/superseb/499f2caa2637c404af41cfb7e5f4a938/raw/930841ac00653fdff8beca61dab9a20bb8983782/k8s-dashboard-user.yml
    [+] Add another addon [no]: no

When the last question is answered, the cluster.yml file will be created in the same directory as RKE was run:

ls -la cluster.yml
-rw-r—– 1 user user 3688 Sep 17 12:50 cluster.yml

You are now ready to build your Kubernetes cluster. This can be done by running rke up. Before you run the command, make sure the ports required are opened between your workstation/laptop/computer and the nodes, and between each of the nodes. You can now build your cluster using the following command:

$ ./rke up
INFO[0000] Building Kubernetes cluster

INFO[0151] Finished building Kubernetes cluster successfully

If all went well, you should have a lot of output from the command but it should end with Finished building Kubernetes cluster successfully. It will also write a kubeconfig file as kube_config_cluster.yml . You can use that file to connect to your Kubernetes cluster.

Exploring your Kubernetes cluster

Make sure you have kubectl installed, see https://kubernetes.io/docs/tasks/tools/install-kubectl/ how to get it for your platform.

Note: When running kubectl, it automatically tries to use a kubeconfig from the default location; $HOME/.kube/config. In the examples, we explicitly specify the kubeconfig file using –kubeconfig kube_config_cluster.yml. If you don’t want to specify the kubeconfig file every time, you can copy the file kube_config_cluster.yml to $HOME/.kube/config. (you probably need to create the directory $HOME/.kube first)

Start with querying the server for its version:

$ kubectl –kubeconfig kube_config_cluster.yml version

Client Version: version.Info
Server Version: version.Info

One of the first things to check, is if all nodes are in Ready state:

$ kubectl –kubeconfig kube_config_cluster.yml get nodes
NAME STATUS ROLES AGE VERSION
host1 Ready controlplane,etcd,worker 11m v1.11.1
host2 Ready controlplane,etcd,worker 11m v1.11.1
host3 Ready controlplane,etcd,worker 11m v1.11.1

When you generated the cluster configuration file, you added the Kubernetes dashboard addon to be deployed on the cluster. You can check the status of the deployment using:

$ kubectl –kubeconfig kube_config_cluster.yml get deploy -n kube-system -l k8s-app=kubernetes-dashboard

NAME DESIRED CURRENT UP-TO-DATE AVAILABLE AGE
kubernetes-dashboard 1 1 1 1 17m

By default, the deployments are not exposed to the outside. If you want to visit the Kubernetes Dashboard in your browser, you will need to expose the deployment externally (which we will do in our demo application later) or use the built-in proxy functionality of kubectl. This will open the 127.0.0.1:8001 (your local machine on port 8001) and tunnel it to the Kubernetes cluster.

Before you can visit the Kubernetes Dashboard, you need to retrieve the token to login to the dashboard. By default, it runs under a very limited account and will not be able to show you all the resources in your cluster. The second addon we added when creating the cluster configuration file created the account and token we need (this is based upon https://github.com/kubernetes/dashboard/wiki/Creating-sample-user)

You can retrieve the token by running:

$ kubectl –kubeconfig kube_config_cluster.yml -n kube-system describe secret $(kubectl –kubeconfig kube_config_cluster.yml -n kube-system get secret | grep admin-user | awk ”) | grep ^token: | awk ‘{ print $2 }’

eyJhbGciOiJSUzI1NiIs….<more_characters>

The string that is returned, is the token you need to login to the dashboard. Copy the whole string.

Set up the kubectl proxy as follows:

$ kubectl –kubeconfig kube_config_cluster.yml proxy

Starting to serve on 127.0.0.1:8001

And open the following URL:

http://localhost:8001/api/v1/namespaces/kube-system/services/https:kubernetes-dashboard:/proxy/

When prompted for login, choose Token, paste the token and click Sign In.

Note: When you don’t get a login screen, open it manually by clicking Sign In on the top right.

Run a demo application

Last step of this post, running a demo application and exposing it. For this example you will run a demo application superseb/rancher-demo, which is a web UI showing the scale of a deployment. It will be exposed using an Ingress, which is handled by the NGINX Ingress controller that is deployed by default. If you want to know more about Ingress, please see https://kubernetes.io/docs/concepts/services-networking/ingress/

Start by deploying and exposing the demo application (which runs on port 8080):

$ kubectl –kubeconfig kube_config_cluster.yml run –image=superseb/rancher-demo rancher-demo –port 8080 –expose
service/rancher-demo created
deployment.apps/rancher-demo created

Check the status of your deployment:

$ kubectl –kubeconfig kube_config_cluster.yml rollout status deployment/rancher-demo

deployment “rancher-demo” successfully rolled out

The command kubectl run is the easiest way to get a container running on your cluster. It takes an image parameter to specify the Docker image and a name at minimum. In this case, we also want to configure the port that this container exposes (internally), and expose it. What happened was that there was a Deployment created (and a ReplicaSet) with a scale of 1 (default), and a Service was created to abstract access to the pods (which can contain one or more containers, in this case 1). For more information on these subjects check the following links:

RKE deploys the NGINX Ingress controller by default on every node. This opens op port 80 and port 443, and can serve as main entrypoint for any created Ingress. An Ingress can contain a single host or multiple, multiple paths, and you can configure SSL certificates. In this post you will configure a basic Ingress, making our demo application accessible on a certain hostname. In the example we will use rancher-demo.domain.test as hostname to access the demo application.

Note: To access our test domain you have to add the domain name to /etc/hosts to visit the UI, as it’s not a valid DNS name. If you have access to your own domain, you can add a DNS A record pointing to each of the nodes.

The only part that is not created, is the Ingress. Let’s create an Ingress calledrancher-demo-ingress, having a host specification to match requests to our test domain (rancher-demo.domain.test), and pointing it to our Service called rancher-demo on port 8080. Save the following content to a file called ingress.yml:

apiVersion: extensions/v1beta1
kind: Ingress
metadata:
name: rancher-demo-ingress
spec:
rules:
– host: rancher-demo.domain.test
http:
paths:
– path: /
backend:
serviceName: rancher-demo
servicePort: 8080

Create this Ingress using kubectl:

$ kubectl –kubeconfig kube_config_cluster.yml apply -f ingress.yml
ingress.extensions/rancher-demo-ingress created

It is time to test accessing the demo application. You can try it on the command-line first, instruct curl to resolve the test domain to each of the nodes:

# Get node IP addresses
$ kubectl –kubeconfig kube_config_cluster.yml get nodes
NAME STATUS ROLES AGE VERSION
10.0.0.1 Ready controlplane,etcd,worker 3h v1.11.1
10.0.0.2 Ready controlplane,etcd,worker 3h v1.11.1
10.0.0.3 Ready controlplane,etcd,worker 3h v1.11.1
# Test accessing the demo application
$ curl –resolve rancher-demo.domain.test:80:10.0.0.1 [http://rancher-demo.domain.test/ping](http://rancher-demo.domain.test/ping)

{“instance”:”rancher-demo-5cbfb4b4-thmbh”,”version”:”0.1″}
$ curl –resolve rancher-demo.domain.test:80:10.0.0.2 [http://rancher-demo.domain.test/ping](http://rancher-demo.domain.test/ping)

{“instance”:”rancher-demo-5cbfb4b4-thmbh”,”version”:”0.1″}
$ curl –resolve rancher-demo.domain.test:80:10.0.0.3
[http://rancher-demo.domain.test/ping](http://rancher-demo.domain.test/ping)

{“instance”:”rancher-demo-5cbfb4b4-thmbh”,”version”:”0.1″}

If you use the test domain, you will need to add it to your machine’s /etc/hosts file to be able to reach it properly.

echo “10.0.0.1 rancher-demo.domain.test” | sudo tee -a /etc/hosts

Now visit http://rancher-demo.domain.test in your browser.

If this has all worked out, you can fill up the demo application a bit more by scaling up your Deployment:

$ kubectl –kubeconfig kube_config_cluster.yml scale deploy/rancher-demo –replicas=10
deployment.extensions/rancher-demo scaled

Note: Make sure to clean up the /etc/hosts entry when you are done.

Closing words

This started as a post how to create a Kubernetes cluster in under 10 minutes, but along the way I tried to add some useful information how certain parts work. To avoid having a post that takes a day to read (explaining every part), there will be other posts describing certain parts. For now, I’ve linked as much resources as possible to existing documentation where you can learn more.

Sebastiaan van Steenis

Sebastiaan van Steenis

Support Engineer

github

Source

Fully automated blue/green deployments in Kubernetes with Codefresh

Out of the box, Kubernetes supports some interesting deployment strategies. From those, the most useful for production deployments is the rolling update. This deployment strategy allows for zero-downtime application upgrades and also offers a gradual rollout of the new application to each pod instance.

Even though rolling updates sound great in theory, in practice, there are several drawbacks. The major one is the lack of easy rollbacks. Attempting to go to the previous version after a deployment has finished is not a straightforward process. A minor disadvantage is also the fact that not all applications are capable of having multiple versions active at the same time.

An alternative way of deployment comes in the form or blue/green (a.ka. red/black) deployments. With this strategy, a full set of both old and new instances exist at the same time. Active traffic is decided via the loadbalancer that selects one of the two sets. This means that doing a rollback is as simple as switching back the load balancer.

Blue green deploymentsBlue green deployments

Unfortunately, Kubernetes does not support blue/green deployments out of the box. It is the responsibility of an external tool or automation solution to implement such deployment. Hopefully, doing blue/green deployments is not that hard. Kubernetes already comes with the basic building blocks (deployments and services) that make a blue/green deployment very easy using plain kubectl commands. The challenge for a sound CI/CD solution is how to automate those kubectl commands so that blue/green deployments happen in a well controlled and repeatable manner.

We have already covered blue/green deployments in a previous Codefresh blog post. There, we explained a way to script a Codefresh pipeline to perform blue/green deployments. This approach works well for people that already know how kubectl works, but is not the most user-friendly way for designing a pipeline.

Blue/Green deployments with a declarative syntax

In this post, we will take blue/green deployments one step further by packaging the kubectl invocations into a pre-packaged Docker image offering a declarative way to do blue/green deployments.

The final result is that in order to deploy using blue/green you can just insert the following build step in your codefresh.yml:

blueGreenDeploy:

title: “Deploying new version ${}”

image: codefresh/k8s-blue-green:master

environment:

– SERVICE_NAME=my-service

– DEPLOYMENT_NAME=my-app

– NEW_VERSION=${}

– HEALTH_SECONDS=30

– NAMESPACE=colors

– KUBE_CONTEXT=myDemoAKSCluster

Here blue/green deployments happen in a completely declarative manner. All kubectl commands are abstracted.

The Blue/Green deploy step is essentially a docker image with a single executable that takes the following parameters as environment variables:

Environment Variable Description
KUBE_CONTEXT Name of your cluster in Codefresh dashboard
SERVICE_NAME Existing K8s service
DEPLOYMENT_NAME Existing k8s deployment
NEW_VERSION Docker tag for the next version of the app
HEALTH_SECONDS How many seconds both colors should coexist. After that new version pods will be checked for restarts
NAMESPACE K8s Namespace where deployments happen

Prerequisites

The blue/green deployments steps expect the following assumptions:

  • An initial service and the respective deployment should already exist in your cluster.
  • The service and the deployment need to use labels that define their version.

The second assumption is very important, as this is how the blue/green step detects the current version and can switch the load balancer to the next version.

You can use anything you want as a “version”, but the recommended approach is to use GIT hashes and tag your Docker images with them. In Codefresh this is very easy because the built-in variable CF_SHORT_REVISION gives you the git hash of the commit that was pushed.

The build step of the main application that creates the Docker image that will be used in the blue/green step is a standard build step that tags the Docker image with the git hash

BuildingDockerImage:

title: Building Docker Image

type: build

image_name: trivial-web

working_directory: ./example/

tag: ‘${}’

dockerfile: Dockerfile

For more details, you can look at the example application
that also contains a service and deployment with the correct labels as well as the full codefresh.yml file.

How to perform Blue/Green deployments

When you run a deployment in Codefresh the pipeline step will print information message on its actions.

Blue/Green deployment logsBlue/Green deployment logs

The blue/green step copies your existing deployment and changes its version, creating a second one with the updated Docker image. At this point, BOTH version (old and new) of your application are deployed in the Kubernetes cluster. All live traffic is still routed to the old application.

There is a waiting period (configurable as an environment parameter as we have seen in the previous section). During this period you are free to do any external checks on your own (e.g. check your health dashboard or run some kind of smoke testing). Once that period is finished, the script checks for the number of restarts in the pods of the new application. If there are any errors, it destroys the new deployment and your cluster is back to the initial state (your users are not affected in any way).

If there are are no pod restarts, the service is switched to point to the new deployment and the old deployment is discarded.

You can also see the changes in the Codefresh Kubernetes dashboard. I am using an Azure Kubernetes cluster, but any cluster will work as long as the labels are present in the manifest files.

Kubernetes DashboardKubernetes Dashboard

And there you have it! Now you can deploy your own application using the blue/green strategy. The blue/green Docker image is also
available in Dockerhub.

New to Codefresh? Create Your Free Account Today!

Source

Introducing Volume Snapshot Alpha for Kubernetes

Author: Jing Xu (Google) Xing Yang (Huawei), Saad Ali (Google)

Kubernetes v1.12 introduces alpha support for volume snapshotting. This feature allows creating/deleting volume snapshots, and the ability to create new volumes from a snapshot natively using the Kubernetes API.

What is a Snapshot?

Many storage systems (like Google Cloud Persistent Disks, Amazon Elastic Block Storage, and many on-premise storage systems) provide the ability to create a “snapshot” of a persistent volume. A snapshot represents a point-in-time copy of a volume. A snapshot can be used either to provision a new volume (pre-populated with the snapshot data) or to restore the existing volume to a previous state (represented by the snapshot).

Why add Snapshots to Kubernetes?

The Kubernetes volume plugin system already provides a powerful abstraction that automates the provisioning, attaching, and mounting of block and file storage.

Underpinning all these features is the Kubernetes goal of workload portability: Kubernetes aims to create an abstraction layer between distributed systems applications and underlying clusters so that applications can be agnostic to the specifics of the cluster they run on and application deployment requires no “cluster specific” knowledge.

The Kubernetes Storage SIG identified snapshot operations as critical functionality for many stateful workloads. For example, a database administrator may want to snapshot a database volume before starting a database operation.

By providing a standard way to trigger snapshot operations in the Kubernetes API, Kubernetes users can now handle use cases like this without having to go around the Kubernetes API (and manually executing storage system specific operations).

Instead, Kubernetes users are now empowered to incorporate snapshot operations in a cluster agnostic way into their tooling and policy with the comfort of knowing that it will work against arbitrary Kubernetes clusters regardless of the underlying storage.

Additionally these Kubernetes snapshot primitives act as basic building blocks that unlock the ability to develop advanced, enterprise grade, storage administration features for Kubernetes: such as data protection, data replication, and data migration.

Which volume plugins support Kubernetes Snapshots?

Kubernetes supports three types of volume plugins: in-tree, Flex, and CSI. See Kubernetes Volume Plugin FAQ for details.

Snapshots are only supported for CSI drivers (not for in-tree or Flex). To use the Kubernetes snapshots feature, ensure that a CSI Driver that implements snapshots is deployed on your cluster.

As of the publishing of this blog, the following CSI drivers support snapshots:

Snapshot support for other drivers is pending, and should be available soon. Read the “Container Storage Interface (CSI) for Kubernetes Goes Beta” blog post to learn more about CSI and how to deploy CSI drivers.

Kubernetes Snapshots API

Similar to the API for managing Kubernetes Persistent Volumes, Kubernetes Volume Snapshots introduce three new API objects for managing snapshots:

  • VolumeSnapshot
    • Created by a Kubernetes user to request creation of a snapshot for a specified volume. It contains information about the snapshot operation such as the timestamp when the snapshot was taken and whether the snapshot is ready to use.
    • Similar to the PersistentVolumeClaim object, the creation and deletion of this object represents a user desire to create or delete a cluster resource (a snapshot).
  • VolumeSnapshotContent
    • Created by the CSI volume driver once a snapshot has been successfully created. It contains information about the snapshot including snapshot ID.
    • Similar to the PersistentVolume object, this object represents a provisioned resource on the cluster (a snapshot).
    • Like PersistentVolumeClaim and PersistentVolume objects, once a snapshot is created, the VolumeSnapshotContent object binds to the VolumeSnapshot for which it was created (with a one-to-one mapping).
  • VolumeSnapshotClass
    • Created by cluster administrators to describe how snapshots should be created. including the driver information, the secrets to access the snapshot, etc.

It is important to note that unlike the core Kubernetes Persistent Volume objects, these Snapshot objects are defined as CustomResourceDefinitions (CRDs). The Kubernetes project is moving away from having resource types pre-defined in the API server, and is moving towards a model where the API server is independent of the API objects. This allows the API server to be reused for projects other than Kubernetes, and consumers (like Kubernetes) can simply install the resource types they require as CRDs.

CSI Drivers that support snapshots will automatically install the required CRDs. Kubernetes end users only need to verify that a CSI driver that supports snapshots is deployed on their Kubernetes cluster.

In addition to these new objects, a new, DataSource field has been added to the PersistentVolumeClaim object:

type PersistentVolumeClaimSpec struct {
AccessModes []PersistentVolumeAccessMode
Selector *metav1.LabelSelector
Resources ResourceRequirements
VolumeName string
StorageClassName *string
VolumeMode *PersistentVolumeMode
DataSource *TypedLocalObjectReference
}

This new alpha field enables a new volume to be created and automatically pre-populated with data from an existing snapshot.

Kubernetes Snapshots Requirements

Before using Kubernetes Volume Snapshotting, you must:

  • Ensure a CSI driver implementing snapshots is deployed and running on your Kubernetes cluster.
  • Enable the Kubernetes Volume Snapshotting feature via new Kubernetes feature gate (disabled by default for alpha):
    • Set the following flag on the API server binary: –feature-gates=VolumeSnapshotDataSource=true

Before creating a snapshot, you also need to specify CSI driver information for snapshots by creating a VolumeSnapshotClass object and setting the snapshotter field to point to your CSI driver. In the example of VolumeSnapshotClass below, the CSI driver is com.example.csi-driver. You need at least one VolumeSnapshotClass object per snapshot provisioner. You can also set a default VolumeSnapshotClass for each individual CSI driver by putting an annotation snapshot.storage.kubernetes.io/is-default-class: “true” in the class definition.

apiVersion: snapshot.storage.k8s.io/v1alpha1
kind: VolumeSnapshotClass
metadata:
name: default-snapclass
annotations:
snapshot.storage.kubernetes.io/is-default-class: “true”
snapshotter: com.example.csi-driver

apiVersion: snapshot.storage.k8s.io/v1alpha1
kind: VolumeSnapshotClass
metadata:
name: csi-snapclass
snapshotter: com.example.csi-driver
parameters:
fakeSnapshotOption: foo
csiSnapshotterSecretName: csi-secret
csiSnapshotterSecretNamespace: csi-namespace

You must set any required opaque parameters based on the documentation for your CSI driver. As the example above shows, the parameter fakeSnapshotOption: foo and any referenced secret(s) will be passed to CSI driver during snapshot creation and deletion. The default CSI external-snapshotter reserves the parameter keys csiSnapshotterSecretName and csiSnapshotterSecretNamespace. If specified, it fetches the secret and passes it to the CSI driver when creating and deleting a snapshot.

And finally, before creating a snapshot, you must provision a volume using your CSI driver and populate it with some data that you want to snapshot (see the CSI blog post on how to create and use CSI volumes).

Creating a new Snapshot with Kubernetes

Once a VolumeSnapshotClass object is defined and you have a volume you want to snapshot, you may create a new snapshot by creating a VolumeSnapshot object.

The source of the snapshot specifies the volume to create a snapshot from. It has two parameters:

  • kind – must be PersistentVolumeClaim
  • name – the PVC API object name

The namespace of the volume to snapshot is assumed to be the same as the namespace of the VolumeSnapshot object.

apiVersion: snapshot.storage.k8s.io/v1alpha1
kind: VolumeSnapshot
metadata:
name: new-snapshot-demo
namespace: demo-namespace
spec:
snapshotClassName: csi-snapclass
source:
name: mypvc
kind: PersistentVolumeClaim

In the VolumeSnapshot spec, user can specify the VolumeSnapshotClass which has the information about which CSI driver should be used for creating the snapshot . When the VolumeSnapshot object is created, the parameter fakeSnapshotOption: foo and any referenced secret(s) from the VolumeSnapshotClass are passed to the CSI plugin com.example.csi-driver via a CreateSnapshot call.

In response, the CSI driver triggers a snapshot of the volume and then automatically creates a VolumeSnapshotContent object to represent the new snapshot, and binds the new VolumeSnapshotContent object to the VolumeSnapshot, making it ready to use. If the CSI driver fails to create the snapshot and returns error, the snapshot controller reports the error in the status of VolumeSnapshot object and does not retry (this is different from other controllers in Kubernetes, and is to prevent snapshots from being taken at an unexpected time).

If a snapshot class is not specified, the external snapshotter will try to find and set a default snapshot class for the snapshot. The CSI driver specified by snapshotter in the default snapshot class must match the CSI driver specified by the provisioner in the storage class of the PVC.

Please note that the alpha release of Kubernetes Snapshot does not provide any consistency guarantees. You have to prepare your application (pause application, freeze filesystem etc.) before taking the snapshot for data consistency.

You can verify that the VolumeSnapshot object is created and bound with VolumeSnapshotContent by running kubectl describe volumesnapshot:

  • Ready should be set to true under Status to indicate this volume snapshot is ready for use.
  • Creation Time field indicates when the snapshot is actually created (cut).
  • Restore Size field indicates the minimum volume size when restoring a volume from the snapshot.
  • Snapshot Content Name field in the spec points to the VolumeSnapshotContent object created for this snapshot.

Importing an existing snapshot with Kubernetes

You can always import an existing snapshot to Kubernetes by manually creating a VolumeSnapshotContent object to represent the existing snapshot. Because VolumeSnapshotContent is a non-namespace API object, only a system admin may have the permission to create it. Once a VolumeSnapshotContent object is created, the user can create a VolumeSnapshot object pointing to the VolumeSnapshotContent object. The external-snapshotter controller will mark snapshot as ready after verifying the snapshot exists and the binding between VolumeSnapshot and VolumeSnapshotContent objects is correct. Once bound, the snapshot is ready to use in Kubernetes.

A VolumeSnapshotContent object should be created with the following fields to represent a pre-provisioned snapshot:

  • csiVolumeSnapshotSource – Snapshot identifying information.
    • snapshotHandle – name/identifier of the snapshot. This field is required.
    • driver – CSI driver used to handle this volume. This field is required. It must match the snapshotter name in the snapshot controller.
    • creationTime and restoreSize – these fields are not required for pre-provisioned volumes. The external-snapshotter controller will automatically update them after creation.
  • volumeSnapshotRef – Pointer to the VolumeSnapshot object this object should bind to.
    • name and namespace – It specifies the name and namespace of the VolumeSnapshot object which the content is bound to.
    • UID – these fields are not required for pre-provisioned volumes.The external-snapshotter controller will update the field automatically after binding. If user specifies UID field, he/she must make sure that it matches with the binding snapshot’s UID. If the specified UID does not match the binding snapshot’s UID, the content is considered an orphan object and the controller will delete it and its associated snapshot.
  • snapshotClassName – This field is optional. The external-snapshotter controller will update the field automatically after binding.

apiVersion: snapshot.storage.k8s.io/v1alpha1
kind: VolumeSnapshotContent
metadata:
name: static-snapshot-content
spec:
csiVolumeSnapshotSource:
driver: com.example.csi-driver
snapshotHandle: snapshotcontent-example-id
volumeSnapshotRef:
kind: VolumeSnapshot
name: static-snapshot-demo
namespace: demo-namespace

A VolumeSnapshot object should be created to allow a user to use the snapshot:

  • snapshotClassName – name of the volume snapshot class. This field is optional. If set, the snapshotter field in the snapshot class must match the snapshotter name of the snapshot controller. If not set, the snapshot controller will try to find a default snapshot class.
  • snapshotContentName – name of the volume snapshot content. This field is required for pre-provisioned volumes.

apiVersion: snapshot.storage.k8s.io/v1alpha1
kind: VolumeSnapshot
metadata:
name: static-snapshot-demo
namespace: demo-namespace
spec:
snapshotClassName: csi-snapclass
snapshotContentName: static-snapshot-content

Once these objects are created, the snapshot controller will bind them together, and set the field Ready (under Status) to True to indicate the snapshot is ready to use.

Provision a new volume from a snapshot with Kubernetes

To provision a new volume pre-populated with data from a snapshot object, use the new dataSource field in the PersistentVolumeClaim. It has three parameters:

  • name – name of the VolumeSnapshot object representing the snapshot to use as source
  • kind – must be VolumeSnapshot
  • apiGroup – must be snapshot.storage.k8s.io

The namespace of the source VolumeSnapshot object is assumed to be the same as the namespace of the PersistentVolumeClaim object.

apiVersion: v1
kind: PersistentVolumeClaim
metadata:
name: pvc-restore
Namespace: demo-namespace
spec:
storageClassName: csi-storageclass
dataSource:
name: new-snapshot-demo
kind: VolumeSnapshot
apiGroup: snapshot.storage.k8s.io
accessModes:
– ReadWriteOnce
resources:
requests:
storage: 1Gi

When the PersistentVolumeClaim object is created, it will trigger provisioning of a new volume that is pre-populated with data from the specified snapshot.

As a storage vendor, how do I add support for snapshots to my CSI driver?

To implement the snapshot feature, a CSI driver MUST add support for additional controller capabilities CREATE_DELETE_SNAPSHOT and LIST_SNAPSHOTS, and implement additional controller RPCs: CreateSnapshot, DeleteSnapshot, and ListSnapshots. For details, see the CSI spec.

Although Kubernetes is as minimally prescriptive on the packaging and deployment of a CSI Volume Driver as possible, it provides a suggested mechanism for deploying an arbitrary containerized CSI driver on Kubernetes to simplify deployment of containerized CSI compatible volume drivers.

As part of this recommended deployment process, the Kubernetes team provides a number of sidecar (helper) containers, including a new external-snapshotter sidecar container.

The external-snapshotter watches the Kubernetes API server for VolumeSnapshot and VolumeSnapshotContent objects and triggers CreateSnapshot and DeleteSnapshot operations against a CSI endpoint. The CSI external-provisioner sidecar container has also been updated to support restoring volume from snapshot using the new dataSource PVC field.

In order to support snapshot feature, it is recommended that storage vendors deploy the external-snapshotter sidecar containers in addition to the external provisioner the external attacher, along with their CSI driver in a statefulset as shown in the following diagram.

In this example deployment yaml file, two sidecar containers, the external provisioner and the external snapshotter, and CSI drivers are deployed together with the hostpath CSI plugin in the statefulset pod. Hostpath CSI plugin is a sample plugin, not for production.

What are the limitations of alpha?

The alpha implementation of snapshots for Kubernetes has the following limitations:

  • Does not support reverting an existing volume to an earlier state represented by a snapshot (alpha only supports provisioning a new volume from a snapshot).
  • Does not support “in-place restore” of an existing PersistentVolumeClaim from a snapshot: i.e. provisioning a new volume from a snapshot, but updating an existing PersistentVolumeClaim to point to the new volume and effectively making the PVC appear to revert to an earlier state (alpha only supports using a new volume provisioned from a snapshot via a new PV/PVC).
  • No snapshot consistency guarantees beyond any guarantees provided by storage system (e.g. crash consistency).

What’s next?

Depending on feedback and adoption, the Kubernetes team plans to push the CSI Snapshot implementation to beta in either 1.13 or 1.14.

How can I learn more?

Check out additional documentation on the snapshot feature here: http://k8s.io/docs/concepts/storage/volume-snapshots and https://kubernetes-csi.github.io/docs/

How do I get involved?

This project, like all of Kubernetes, is the result of hard work by many contributors from diverse backgrounds working together.

In addition to the contributors who have been working on the Snapshot feature:

We offer a huge thank you to all the contributors in Kubernetes Storage SIG and CSI community who helped review the design and implementation of the project, including but not limited to the following:

If you’re interested in getting involved with the design and development of CSI or any part of the Kubernetes Storage system, join the Kubernetes Storage Special Interest Group (SIG). We’re rapidly growing and always welcome new contributors.

Source

Istio at 1.0 – Why should you care? /

14/Sep 2018

By James Munnelly

Businesses operating at scale face several challenges. Not only must many applications be maintained – running in different environments and built in different languages – but application behavior should be monitored closely, whilst adhering to strict security policies. There is a lot to juggle.

The open service-mesh platform Istio – founded in April 2017 by Google, IBM & Lyft – provides users with the ability to connect, manage, and secure microservices. It takes care of monitoring by providing detailed logging and visibility, connectivity by giving the ability to control traffic flow between services, and also security by providing flexible authorisation policies and transparent mutual authentication/encryption.

istio

Given that Istio can be deployed on Kubernetes, we at Jetstack have already worked with a large media customer to increase their ability to introspect network traffic and application behaviour. They can also utilise Istio’s telemetry capabilities to gain a detailed view of application behaviour and swiftly respond to issues.

This summer brought us the release of Istio 1.0. This version introduces many new features that make the product even more appealing. These improve security and make Istio more language agnostic. The Jetstack engineers working on our Istio project have reviewed the new release, and have picked out some of the key aspects that they believe will offer value.

Istio 1.0

  • Policy can be enforced centrally. This means there’s no more relying on developers or third party applications to enforce authentication, saving time and additional costs. Policy control is also fine-grained, and based on specific application attributes.
  • Business-level constructs no longer have to be tied to individual languages. For instance, you can implement resource quotas, load balancing policies, and authentication without modifying applications.
  • Moving from traditional infrastructure has been made easier in this release. Simply deploy your application, manage important security-related or performance-related behaviour centrally without messing with ‘legacy’ apps.
  • There is a significant push towards ‘zero trust networks’ in this release. There is no more firewalling from public internet, and central control plane allows visualisation of these boundaries. Security is a priority.
  • Built-in telemetry gives the user a detailed insight into application behaviour, and the ability to monitor the application for any issues.
  • Service discovery and communication across clusters and regions: Finally, true multi-region application deployments!
  • There are now clearly defined roles and purposes within the organisation. These include defining who manages Ingress Gateways, application quotas, rate limits, and traffic policies.

laptop

In addition to these new features, it must be noted that Istio 1.0 lays a solid foundation for a platform upon which to build more. For this reason, we have a lot to look forward to, not just in the upcoming release, but in the roadmap of the platform.
You can see evidence of this in the recent announcement of Knative – which makes heavy use of the advanced traffic management features in Istio to build a higher level interface for users to interact with.

We see Kubernetes being adopted at an astounding rate with many customers already investigating service mesh options. Given how far we’ve come since v1 of Kubernetes, imagine what Istio 1.11 will look like in a couple of years!

If you want to get started with Istio today, head on over to the getting started guide. You can get set up and running using the Helm chart deployment, which will take care of getting you from zero to Istio in just a few minutes!

Interested in exploring Istio for your business? Reach out to our team at hello@jetstack.io.

Source

Improving the multi-team Kubernetes ingress experience with Heptio Contour 0.6

Kubernetes has a variety of primitives that make it a great platform for running workloads submitted by multiple teams. Features like Role Based Access Control (RBAC) and Namespaces make it possible to divide clusters across multiple teams in a safe way. There are some challenges however, and one of the most important ones our enterprise customers have encountered lies in the Ingress API. In this post, we will explore how a bad Ingress resource can break your ingress layer, and walk through our novel approach to multi-team ingress using Heptio Contour’s new IngressRoute resource.

Multi-team Ingress on Kubernetes
Most organizations typically have more than one team interacting with a given cluster. Cluster operators assign one or more namespaces to each team and use RBAC to ensure that no team can mess with another team’s resources.
Even though Ingress is a namespaced resource that can be locked down with RBAC, it poses a challenge in multi-team clusters because it controls cluster-level configuration: the hosts and paths on which to serve application traffic.
Let us imagine a scenario where the marketing team owns www.example.com/blog. They are responsible for the organization’s blog and they have configured an Ingress resource that looks like this:

apiVersion: extensions/v1beta1
kind: Ingress
metadata:
name: blog
namespace: marketing
spec:
rules:
– host: www.example.com
http:
paths:
– path: /blog
backend:
serviceName: blog
servicePort: 80

Now, the engineering team is looking to run their own engineering-focused blog, and they mistakenly apply the following Ingress resource into the engineering namespace:

apiVersion: extensions/v1beta1
kind: Ingress
metadata:
name: blog
namespace: engineering
spec:
rules:
– host: www.example.com
http:
paths:
– path: /blog
backend:
serviceName: engineering-blog
servicePort: 80

We now have two conflicting Ingress configurations that point www.example.com/blog to different services. The Ingress API does not define how to handle this conflict and the behavior of Ingress Controllers frequently differs — this results in a negative user experience affecting multiple parties. The engineering team is completely unaware that they have taken down the company blog, while the avid blog readers are unable to access their favorite blog.
As you can see in this example, the Ingress resource can become the Achilles’ heel of a multi-team cluster. We have heard from multiple customers that have been bitten by this in production, and thus we decided to address this issue in Contour.
IngressRoute delegation to the rescue
One of the most exciting features introduced in the latest version of Heptio Contour is the IngressRoute Custom Resource Definition (CRD). Among the many improvements available in this new custom resource is delegation support, which allow you to delegate the configuration of a specific host or path to another IngressRoute.
The crux of the problem with the Ingress resource in a multi-team cluster is that operators do not have a way to prevent teams from claiming hosts and paths at will. The ability to create root IngressRoutes in a specific namespace, as well as the ability to do cross-namespace delegation is our answer to this problem.
Using the delegation feature of the IngressRoute, cluster operators get full control of the roots of their ingress layer by limiting which namespaces are authorized to create root IngressRoutes. This eliminates the possibility for two teams to create configurations that collide. The IngressRoute roots specify the top level domains and TLS configuration, while delegating the configuration of specific subdomains or paths to other IngressRoutes in other namespaces. In this way, each team gets the ability to use and configure the slice of the ingress space that has been delegated to their team’s namespace.
Let us revisit the problematic scenario we outlined above. The cluster operator creates a “roots” namespace, and configures Contour to only accept root IngressRoutes from this namespace. Then, the cluster operator creates a root IngressRoute for www.example.com and delegates the /blog path to the marketing team:

apiVersion: contour.heptio.com/v1beta1
kind: IngressRoute
metadata:
name: example-com-root
namespace: roots
spec:
virtualhost:
fqdn: www.example.com
routes:
– match: /blog
delegate:
name: blog
namespace: marketing

The marketing team creates an IngressRoute that sets up the company blog. Note that the virtualhost is missing, as this is not a root IngressRoute.

apiVersion: contour.heptio.com/v1beta1
kind: IngressRoute
metadata:
name: blog
namespace: marketing
spec:
routes:
– match: /blog
services:
– name: blog
port: 80

As you might imagine, if the engineering team were to create a conflicting IngressRoute, the company’s blog would remain accessible as there is no delegation path that points to the engineering team IngressRoute. Instead of producing an outage, Contour ignores the orphaned route and sets its status field accordingly:

apiVersion: contour.heptio.com/v1beta1
kind: IngressRoute
metadata:
name: blog
namespace: engineering
spec:
routes:
– match: /blog
services:
– name: engineering-blog
port: 80
status:
currentStatus: orphaned
description: this IngressRoute is not part of a delegation chain from a root IngressRoute

What’s next?
We have explored the new IngressRoute and more specifically, the delegation model that enables you to run multi-team Kubernetes clusters in a safe way; this is one of the exciting features available in the latest version of Heptio Contour. But, there’s more.
In future posts, we will explore other patterns enabled by the IngressRoute, including blue/green deployments, canary deployments and load balancing strategies. If you have any questions, or are interested in learning more, feel to reach us via the #contour channel on the Kubernetes community Slack, or follow us on Twitter.
Source